The 2022 Bear Market: Month-by-Month Fear & Greed Timeline
The 2022 bear market was a defining period for modern investors. Unlike the swift, V-shaped recovery witnessed during the 2020 COVID-19 crash, 2022 was a slow, agonizing bleed. It punished those who tried to "buy the dip" prematurely and rewarded extreme patience. At its core, the 2022 decline was driven by a historic shift in macroeconomic policy: the Federal Reserve embarked on one of the most aggressive rate hike cycles in history to combat inflation that peaked at a staggering 9.1%. However, numbers alone do not capture the emotional toll of that year.
By examining the 2022 bear market through the lens of the Fear & Greed Index, we gain a unique, month-by-month understanding of how investor psychology evolved from stubborn complacency to outright capitulation. This historical timeline serves as a masterclass in market sentiment, revealing how hope was repeatedly weaponized against retail investors and how the ultimate bottom was forged in the fires of maximum pessimism.
The Catalyst: Inflation and the End of Free Money
To understand the sentiment timeline, we must establish the context. Coming out of 2021, the market was flush with liquidity. Interest rates were near zero, and stimulus checks had fueled speculative manias in tech stocks, meme stocks, and cryptocurrencies. The Fear & Greed Index had spent much of late 2021 firmly in the Greed zone. However, beneath the surface, inflation was accelerating rapidly. The narrative that inflation was "transitory" began to fracture. When Fed Chair Jerome Powell signaled a definitive pivot toward quantitative tightening, the psychological foundation of the bull market cracked.
The 2022 Fear & Greed Data Timeline
The following table tracks the monthly average of the Fear & Greed Index alongside crucial market milestones. Notice how sentiment persistently degraded, briefly rebounded during bear market rallies, and ultimately plunged into extreme fear.
| Month (2022) | Avg F&G Reading | Sentiment Zone | S&P 500 Context / Key Events |
|---|---|---|---|
| January | 55 | Neutral | S&P hits ATH 4,818; early tech weakness begins. |
| February | 35 | Fear | Russia invades Ukraine; geopolitical anxiety spikes. |
| March | 37 | Fear | First Fed rate hike (25 bps); brief relief rally. |
| April | 25 | Fear | S&P drops 8.8%; tech sector begins to unravel rapidly. |
| May | 14 | Extreme Fear | S&P drops to 4,132; CPI hits 8.6%, shocking markets. |
| June | 6 | Extreme Fear | CPI peaks at 9.1%; S&P hits summer low of 3,666. |
| July | 37 | Fear | S&P rallies 9%; the first major "false bottom." |
| August | 52 | Neutral | Powell's Jackson Hole speech crushes pivot hopes. |
| September | 20 | Extreme Fear | S&P plunges to 3,585; massive wealth destruction. |
| October | 18 | Extreme Fear | The final capitulation and the start of the true bottom. |
| November | 38 | Fear | CPI shows cooling; slow recovery begins. |
| December | 40 | Fear | Tax loss harvesting keeps sentiment subdued. |
Q1: The Denial Phase (January - March)
The year began in a state of denial. In January, the index hovered at a Neutral 55. Despite the Federal Reserve clearly telegraphing its intentions to raise rates, many investors believed the market could absorb the hikes without significant damage. Growth stocks were taking a beating, but large-cap tech held the major indices afloat. In February, the Russian invasion of Ukraine sent shockwaves through global energy and commodity markets, dragging the sentiment index down to 35. However, the true economic impact was still being debated. By March, following the Fed's first modest 25 basis point hike, the market actually staged a relief rally, briefly convincing participants that the worst was over. This was the first of many traps.
Q2: The Awakening and the June Collapse (April - June)
April marked the brutal awakening. Inflation data continued to print hotter than expected, and the realization set in that the Fed would have to act far more aggressively. The S&P 500 suffered an 8.8% decline in April alone, pushing the Fear & Greed Index to the precipice of Extreme Fear (25). In May, the reading cratered to 14. The bleeding culminated in June when CPI printed an agonizing 9.1%. The market panicked. The Fear & Greed Index plummeted to an abysmal 6 out of 100—a level of sheer terror rarely seen outside of systemic financial crises. The S&P 500 tagged what appeared to be an ultimate bottom at 3,666.
"A reading of 6 on the Fear & Greed Index represents total capitulation. It is the moment when investors sell not because they want to, but because margin calls and psychological exhaustion force them to."
Q3: The Summer Mirage and the Jackson Hole Hammer (July - September)
Perhaps the most fascinating psychological period of 2022 was the summer. From mid-June through mid-August, the S&P 500 staged a powerful bear market rally, surging over 15%. Investors convinced themselves that inflation had peaked and that a "Fed pivot" (a return to rate cuts) was imminent. The Fear & Greed Index recovered sharply, climbing from 6 all the way back to a Neutral 52 by mid-August. This was the most devastating false bottom of the year.
The mirage shattered entirely in late August at the Jackson Hole Economic Symposium. Fed Chair Powell delivered a brutally short, hawkish speech, explicitly stating that fighting inflation would bring "some pain to households and businesses." The market realized the pivot was a fantasy. September saw a relentless, indiscriminate sell-off. By the end of the month, the S&P 500 had broken below its June lows, hitting 3,585. The Fear & Greed Index violently re-entered the Extreme Fear zone, registering a 20. Retail portfolios were decimated.
Q4: The Double Bottom and the Birth of a New Cycle (October - December)
October 2022 is a textbook study in market bottoming dynamics. Early in the month, a hot inflation print initially sent the S&P 500 plunging at the opening bell. The Fear & Greed Index registered an 18. Yet, something remarkable happened: by the end of the day, the market had staged a massive, inexplicable reversal, closing deeply in the green. This was the definitive signal that all the weak hands had been flushed from the system. The market had absorbed terrible news and refused to go lower. This classic "double bottom" (testing the June lows and holding) marked the structural end of the bear market.
As November and December progressed, inflation finally began to show signs of structural cooling. While the Fear & Greed Index remained subdued in the 30s and 40s (largely due to year-end tax loss harvesting), the underlying bid in the market was quietly strengthening. The foundation for the 2023 bull run had been poured in the depths of October's despair.
3 Times Investors Thought the Bottom Was In (The False Bottoms)
- March 2022: A quick relief rally following the first tiny Fed hike. Sentiment improved briefly, but inflation was still accelerating.
- August 2022: The "Fed Pivot" narrative drove the S&P up 15%. Sentiment hit Neutral (52), blinding investors to Powell's resolve.
- September 2022: When the market approached the June lows, many bought blindly, assuming support would hold. It didn't, resulting in severe losses before the true October bottom.
Lessons for Navigating Slow Grinding Bear Markets
The defining characteristic of the 2022 bear market was its duration. Unlike the 2020 COVID crash, which was a terrifying but brief exogenous shock, 2022 was a slow structural unwinding. Fast crashes usually feature a single, sharp drop in the Fear & Greed Index into the single digits, followed by an immediate V-shaped recovery. Slow bear markets, conversely, feature rolling waves of fear.
The crucial lesson for investors is that in a macroeconomic tightening cycle, a single Extreme Fear reading is rarely enough to signal an all-clear. The market must endure a prolonged period of psychological punishment. You must look for divergences—such as the October scenario where bad news failed to drive prices lower. Furthermore, 2022 taught us to distrust bear market rallies that lack fundamental catalysts. When the sentiment index recovers to Neutral while the macroeconomic picture remains dire, it is almost always a bull trap.
Using Historical Context with ThinqStock
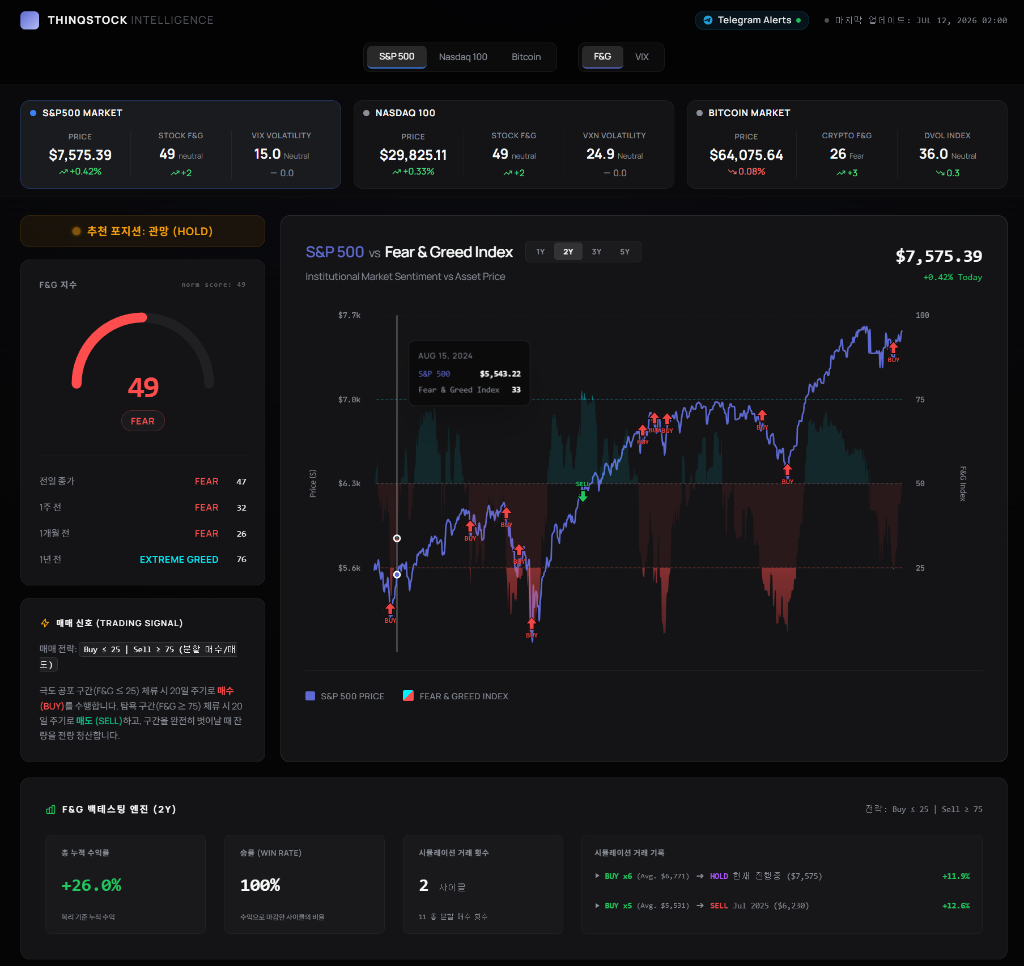
Understanding this historical timeline is essential for future risk management. The ThinqStock platform features an advanced historical backtesting and comparison module. When the market enters a downturn, you can overlay the current sentiment trajectory against the 2022 bear market data. Are we experiencing a fast crash or a slow grind? Are we seeing the hallmark signs of a false summer rally, or the genuine capitulation of a double bottom? By studying the psychological patterns of 2022, you arm yourself with the emotional fortitude required to survive the next great market correction.