How to Trade the Bitcoin Fear and Greed Index (5-Year Data)
The Bitcoin Fear and Greed Index is the most widely watched sentiment indicator in the crypto market. When the index registers extreme fear, it historically presents high-reward buying opportunities for Bitcoin investors. The index is arguably the most extreme sentiment indicator in any major asset class. On a 0–100 scale, Bitcoin's index has registered single-digit readings — moments of near-total capitulation — on multiple occasions, followed by rallies that would be extraordinary by any historical standard. It has also spent extended periods above 90, reflecting the kind of speculative euphoria that traditional markets rarely sustain for long.
If you want to understand how to read crypto market psychology, the Bitcoin Fear & Greed Index is essential. But it requires a fundamentally different interpretive framework than its stock-market equivalent. Crypto extremes are genuinely more extreme, the reversals are sharper, and the data set — while growing — has distinct limitations compared to decades of equity market history.
This analysis covers five years of Bitcoin Fear & Greed data at extreme levels, the structural differences between crypto and equity sentiment indicators, how to use Deribit's DVOL metric alongside Fear & Greed for a more complete picture, and three detailed case studies of extreme fear events and their aftermath.
How the Bitcoin Fear & Greed Index Differs From the Stock Market Version
The most widely used Bitcoin Fear & Greed Index (published by Alternative.me) draws on a different set of inputs than the CNN stock market version. Understanding what's being measured matters enormously for interpretation.
The crypto index weights six components: volatility (25%) — comparing current Bitcoin price volatility to 30-day and 90-day averages; market momentum and volume (25%) — comparing current volume and momentum to recent averages; social media (15%) — sentiment analysis of Bitcoin-related posts and engagement rates; surveys (15%) — periodic polling of crypto market participants on near-term price expectations; Bitcoin dominance (10%) — BTC's share of total crypto market capitalization; and Google Trends (10%) — search volume for Bitcoin-related terms, particularly fear-related queries.
Key Structural Differences: Crypto vs. Stock Fear & Greed
- 24/7 market: Crypto markets never close. Sentiment can shift dramatically overnight without any mechanism for markets to absorb and reset after extended hours.
- No institutional hedging floor: When equities crash, pension funds and endowments provide buying pressure at lower levels. Crypto lacks this natural buyer base during severe crashes.
- Higher retail participation: Crypto markets are more retail-dominated, meaning sentiment swings are amplified by less sophisticated and more emotionally reactive participants.
- Leverage amplification: Crypto derivatives markets allow extreme leverage (up to 100x on some platforms). Liquidation cascades during selloffs drive extreme Fear & Greed readings.
- Regulatory uncertainty tail risk: A stock market crash doesn't threaten the legality of owning stocks. Crypto crises sometimes involve genuine existential regulatory risk, which justifies more extreme fear readings.
Historical Extreme Fear Events: The Data Table
The following table captures the most significant extreme fear readings in Bitcoin's Fear & Greed Index history, with concurrent BTC price and subsequent return data.
| Period / Catalyst | F&G Score | BTC Price | +30 Day Return | +90 Day Return | +365 Day Return |
|---|---|---|---|---|---|
| Nov 2018 – Crypto Winter | 8 | ~$3,500 | -15.4% | +22.3% | +282.9% |
| Dec 2018 – Post-BCH Fork | 12 | ~$3,200 | +3.1% | +31.2% | +304.7% |
| Mar 2020 – COVID Black Thursday | 10 | ~$4,000 | +71.1% | +142.5% | +968.0% |
| Jul 2021 – China Mining Ban | 15 | ~$29,800 | +63.4% | +58.9% | -43.2% |
| Jun 2022 – LUNA/3AC Collapse | 6 | ~$17,500 | -7.3% | -27.8% | +88.4% |
| Nov 2022 – FTX Collapse | 18 | ~$16,100 | +3.2% | +31.4% | +196.3% |
The data reveals a more complex picture than the stock market equivalent. While the 365-day returns following extreme fear readings are strikingly positive in most cases (averaging over +300% across the non-2021 episodes), the short-term behavior is far more variable. The June 2022 LUNA/3AC collapse, for example, saw continued price weakness for 90 days before the major recovery materialized. Crypto extreme fear does not guarantee a rapid bottom — but it has consistently preceded significant multi-year appreciation.
Why Crypto Extremes Are More Extreme
Bitcoin's Fear & Greed Index regularly hits single digits — readings almost never seen in the equity Fear & Greed Index. Understanding why helps calibrate how to interpret these readings.
Leverage Liquidation Cascades
One of the defining features of crypto market crashes is the role of leveraged position liquidation. When Bitcoin's price drops rapidly, leveraged long positions on exchanges like Binance, Bybit, and OKX are automatically liquidated — which generates additional sell pressure, which triggers more liquidations, in a feedback loop that can push prices far below fundamental support levels in hours.
On March 12, 2020 — "Black Thursday" — this mechanism drove Bitcoin from $7,900 to $3,800 in a single day. More than $1 billion in leveraged long positions were liquidated within 24 hours. The Fear & Greed Index printed 10 — an extreme reading that historically accompanied some of crypto's greatest buying opportunities.
Social Media Sentiment Amplification
The crypto market's heavy reliance on Twitter, Reddit, and Telegram for information distribution means sentiment can shift with viral speed. A single high-profile tweet about regulatory action or exchange solvency can trigger a Fear & Greed collapse before any fundamental news has been verified. This creates more frequent extreme readings than equity markets, where information typically propagates more slowly through institutional channels.
The Retail Capitulation Effect
Crypto's retail-dominated investor base means the "last seller" phenomenon occurs at more extreme levels. Retail investors — who are more likely to be emotionally driven and to have bought near peaks — capitulate more completely than institutional investors with defined risk management frameworks. This produces Fear & Greed troughs that are genuinely extreme relative to fundamental valuations.
"In crypto, when everyone is talking about how Bitcoin is dead, it usually has one or two more life cycles in it. The obituaries have been written hundreds of times. The contrarian who bought at each declaration of death has fared extraordinarily well." — A perspective shared by long-term Bitcoin investors across multiple market cycles.
Case Study 1: November–December 2018 — Crypto Winter's Deepest Point
The 2018 crypto bear market was Bitcoin's longest and deepest to that point. After peaking at nearly $20,000 in December 2017, Bitcoin fell to $3,200 by December 2018 — an 84% decline over 12 months. The Fear & Greed Index hit 8 in November 2018, then remained in extreme fear territory through most of December.
The narrative at the time was unambiguous: crypto was dead. Institutional adoption had failed to materialize. The ICO boom had collapsed into fraud and failure. Regulatory pressure was mounting globally. CNBC aired a segment asking whether Bitcoin was heading to zero.
Twelve months later, Bitcoin was trading at approximately $13,800 — a 330% increase from December 2018's lows. Within 18 months, it was approaching its prior all-time high. The extreme fear of late 2018 marked not the end of Bitcoin, but the beginning of its next major cycle.
Case Study 2: March 2020 — Black Thursday
The COVID-related panic of March 2020 hit crypto markets earlier and harder than equity markets. On March 12, 2020, Bitcoin plunged 50% in 24 hours — one of the single worst days in its history. The Fear & Greed Index hit 10. The crash was so violent that major exchanges including BitMEX experienced system outages as they were overwhelmed by liquidation activity.
What made this episode particularly remarkable was the speed and magnitude of the subsequent recovery. Within 30 days of the Fear & Greed trough, Bitcoin had gained 71%. Within 90 days, it was up 142.5%. And by March 2021 — exactly 12 months from the bottom — Bitcoin was trading above $58,000, representing a gain of nearly 1,000% from the COVID crash low.
The March 2020 Bitcoin crash exemplifies why crypto extreme fear readings, despite their frightening appearance, have historically represented extraordinary risk/reward setups for patient investors.
Case Study 3: June 2022 — LUNA and the Systemic Contagion Crisis
The May–June 2022 collapse of the Terra/LUNA ecosystem represented the most significant systemic crisis in crypto history to that point. The algorithmic stablecoin UST lost its peg, triggering the complete collapse of both UST and LUNA — which at peak had a combined market cap exceeding $40 billion. The contagion spread rapidly to crypto lenders (Celsius, Voyager), hedge funds (Three Arrows Capital), and eventually to the FTX exchange collapse in November 2022.
The Bitcoin Fear & Greed Index hit 6 in mid-June 2022 — the lowest reading since the 2018 crypto winter. BTC was trading around $17,500. Unlike the 2020 episode, the recovery was neither swift nor linear. Continued contagion through the summer and the FTX collapse in November 2022 pushed Bitcoin to a final low of approximately $15,800 in November — another 10% below the June Fear & Greed trough.
However, by June 2023 — 12 months from the extreme fear reading — Bitcoin had recovered to approximately $30,200, representing an 88.4% gain from the June 2022 levels. The lesson: crypto systemic crises produce bottoms that are messier and more protracted than simple panic-driven crashes, but the 12-month forward returns from extreme fear readings have remained compelling.
Using DVOL Alongside the Fear & Greed Index
Deribit's Bitcoin Volatility Index (DVOL) is the crypto equivalent of the equity market's VIX — a real-time measure of the options market's implied 30-day volatility for Bitcoin. Just as VIX spikes above 30 are contrarian signals in equity markets, DVOL spikes above 80–100% provide similar signals in crypto.
Reading the DVOL-Fear & Greed Combination
| DVOL Level | BTC F&G Level | Signal Interpretation | Historical Bias |
|---|---|---|---|
| Above 100% | Below 15 | Maximum capitulation signal | Strong positive 6–12 month bias |
| 80–100% | 15–25 | Elevated fear, opportunity developing | Positive 6–12 month bias |
| 50–80% | 25–45 | Normal crypto volatility range | Neutral directional signal |
| Below 40% | Above 70 | Complacency — potential peak | Caution: elevated correction risk |
During the March 2020 crash, DVOL surged above 180% while the Fear & Greed Index hit 10. During the June 2022 LUNA crisis, DVOL exceeded 120% while Fear & Greed was at 6. Both of these simultaneous extremes marked periods of exceptional subsequent returns despite near-term continued volatility.
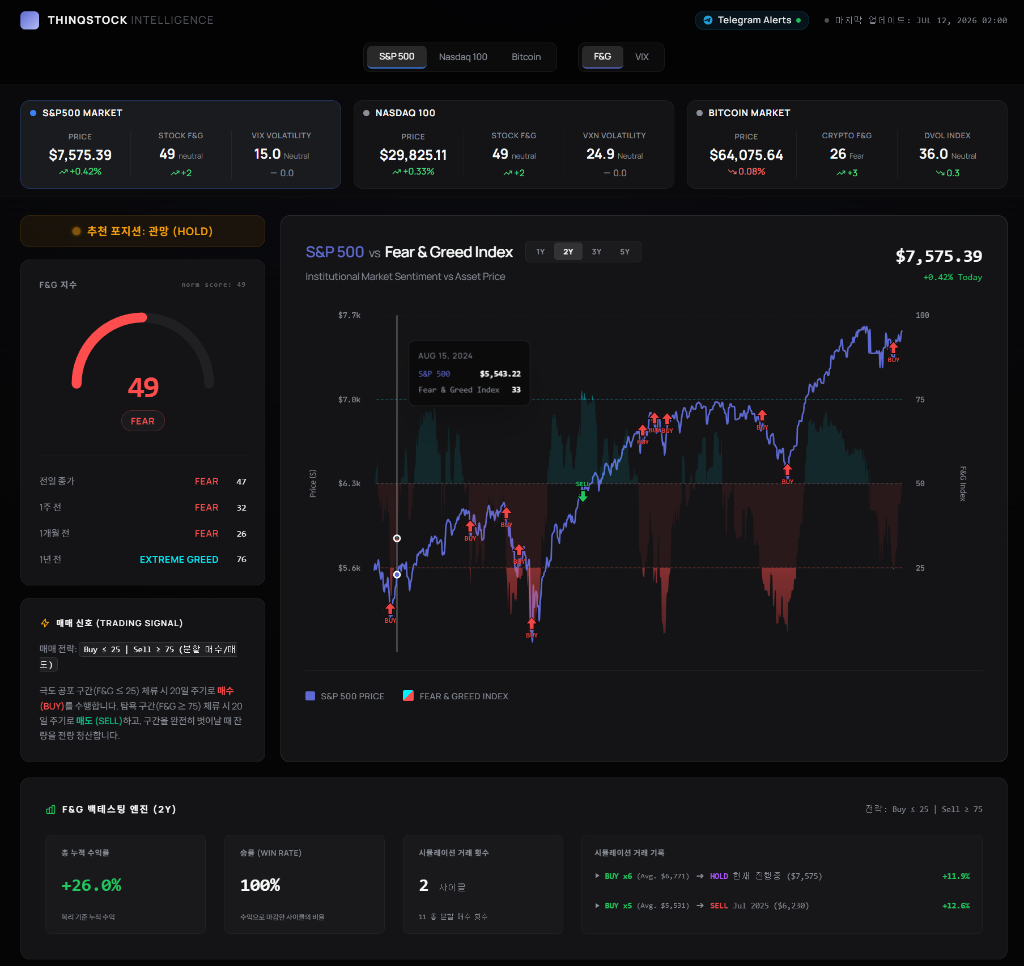
The ThinqStock dashboard tracks Bitcoin sentiment metrics alongside traditional equity sentiment data, providing a cross-asset view of market psychology that's difficult to assemble manually.
The Greed Side: What Extreme Readings Above 80 Signal
The analysis so far has focused on extreme fear as a buying signal, but the crypto Fear & Greed Index's greed extremes are equally actionable — as cautionary signals for over-weighted positions.
When Bitcoin's Fear & Greed Index exceeds 80 and sustains those levels for weeks, it historically reflects the late stages of a bull market cycle. In December 2017, the index was above 90 for most of the month — while Bitcoin peaked at $19,783 before losing 84% over the following year. In April 2021, readings above 80 persisted while Bitcoin was approaching $65,000 — before falling more than 50% by the following summer.
The greed signal doesn't mean "sell everything immediately" — bull markets can persist in extreme greed for months. But sustained readings above 80 historically indicate a higher probability of a significant correction within the following 3–6 months.
Practical Framework for Crypto Sentiment Investing
Given crypto's higher volatility and more extreme sentiment swings, a modified framework from the equity market approach is warranted:
- Extend your time horizon expectations. Crypto extreme fear readings can precede 30–90 day periods of continued weakness. A 12-month minimum holding window is even more important in crypto than in equities.
- Size positions to reflect the asset's inherent volatility. A position that feels comfortable in S&P 500 terms may be psychologically unbearable in Bitcoin terms, where 30–40% additional drawdowns after entry are not uncommon even from apparent extremes.
- Watch for systemic vs. panic triggers. A Fear & Greed reading of 10 caused by broader market panic (like COVID) typically recovers faster than a reading of 6 caused by systemic crypto contagion (like LUNA/3AC). The latter requires more patience.
- Use the DVOL confirmation. When DVOL spikes above 80% simultaneously with a Fear & Greed reading below 20, the evidence for a medium-term bottom is stronger than either indicator alone.
- Dollar-cost averaging dominates lump-sum in crypto extremes. Given the difficulty of identifying exact bottoms, deploying capital weekly over 8–12 weeks during extreme fear periods historically produces better risk-adjusted outcomes than a single lump-sum entry.
"Bitcoin has been declared dead over 400 times in mainstream media articles. Every single time, the price is higher five years later than it was at the time of the obituary. This is not a coincidence — it reflects the power of a decentralized system with a fixed supply schedule and growing global adoption." — An observation that has proven consistently accurate since 2010.
The Longer View: Why Bitcoin Extremes Matter Less Over Time
One of the most counterintuitive findings in five years of Bitcoin Fear & Greed data is that the specific entry point during extreme fear periods matters less and less as your holding period extends. An investor who bought Bitcoin at the November 2018 Fear & Greed trough of 8, at $3,500, and an investor who bought three months earlier at $7,000 (a 50% premium), were both substantially profitable by 2021. The extreme fear entry produced better returns — but both produced extraordinary returns over a 3-year horizon.
This suggests that for long-term Bitcoin investors, monitoring the Fear & Greed Index serves a dual purpose: it identifies optimal entry points for those with dry powder available, and it provides psychological anchoring during periods when the noise is loudest and the temptation to sell is greatest. Knowing that a Fear & Greed reading of 6 has historically preceded massive appreciation doesn't make the short-term pain disappear — but it does make it more endurable.
Track Bitcoin's Fear & Greed Index alongside broader market sentiment data on the ThinqStock dashboard to build a more complete cross-asset picture of market psychology and identify moments when the data historically favors patient, long-horizon investors.