The 2020 COVID Crash: A Fear & Greed Timeline
No market event in modern history compressed so much fear, panic, and eventual recovery into such a short window as the 2020 COVID-19 crash. What took 17 months to play out in the 2008 financial crisis happened in just 33 days in 2020. The S&P 500 fell 34% from peak to trough in just over a month — the fastest bear market on record — before staging one of the most aggressive recoveries ever witnessed.
For investors who track the Fear & Greed Index, 2020 was a masterclass. The sentiment indicators didn't just react to the crash — for those watching closely, they told a remarkable story in real time. This article walks through a month-by-month timeline of how market sentiment evolved during 2020, what the Fear & Greed readings looked like at each critical turning point, and what lessons we can extract for the next major market dislocation.
"The COVID crash of 2020 is the cleanest case study we have for sentiment-based investing. The Fear & Greed Index hit single digits at the exact moment the S&P 500 was at its lowest. Investors who bought the fear instead of selling it were rewarded with 50%+ returns within a year."
The Full 2020 Sentiment Timeline
The table below shows the approximate Fear & Greed Index readings at key moments throughout 2020, alongside the S&P 500 level and VIX for context.
| Date | F&G Score | Sentiment Zone | S&P 500 | VIX | Key Event |
|---|---|---|---|---|---|
| Jan 2020 | 75 | Greed | 3,265 | 12.1 | Markets at all-time highs |
| Feb 19, 2020 | 68 | Neutral/Greed | 3,386 (ATH) | 13.7 | S&P 500 peak before crash |
| Feb 27, 2020 | 34 | Fear | 2,978 | 27.8 | First major sell-off week |
| Mar 9, 2020 | 12 | Extreme Fear | 2,746 | 54.5 | Oil price war + COVID fear |
| Mar 16, 2020 | 8 | Extreme Fear | 2,386 | 82.7 | Circuit breakers triggered |
| Mar 23, 2020 | 3 | Extreme Fear | 2,237 (LOW) | 65.5 | Absolute market bottom |
| Apr 2020 | 28 | Fear | 2,913 | 35.0 | Fed stimulus kicks in |
| May 2020 | 42 | Neutral | 2,955 | 27.5 | Reopening optimism |
| Jun 2020 | 48 | Neutral | 3,100 | 28.0 | Recovery continues |
| Aug 2020 | 72 | Greed | 3,508 | 22.0 | New all-time high territory |
| Sep 2020 | 40 | Neutral | 3,363 | 28.5 | Tech-led pullback |
| Nov 2020 | 78 | Extreme Greed | 3,621 | 20.6 | Vaccine news rally |
| Dec 2020 | 80 | Extreme Greed | 3,756 | 19.5 | Year-end rally |
January 2020: The Calm Before the Storm
As 2020 began, market sentiment sat comfortably in the Greed zone around 75. The S&P 500 was pushing toward 3,300, and investors had spent all of 2019 watching the index climb 29%. The VIX was subdued at roughly 12, and there was no widespread fear of a coming collapse.
Reports of a novel coronavirus in Wuhan, China were beginning to surface in late January, but markets largely dismissed them as a regional issue. Sentiment dipped briefly but quickly recovered. In hindsight, this complacency was a warning sign — though one almost impossible to act on without the benefit of what came next.
February 19–27: The Fastest 10% Drop in History
On February 19, 2020, the S&P 500 hit its all-time high of 3,386. Seven trading days later, it had fallen more than 12%. This was the fastest 10% decline from a peak in the history of the index. The Fear & Greed Index fell from the mid-60s to the mid-30s within that week.
What drove the sudden panic was the realization that COVID-19 was not contained to Asia. As cases appeared in Italy and Iran, investors began repricing the risk of a global pandemic. The VIX spiked from below 14 to nearly 28 in those seven days — a move that historically signals genuine institutional concern rather than retail noise.
Key Lesson: Speed of Sentiment Collapse
The transition from Greed (68) to Fear (34) in just one week shows how quickly sentiment can reverse. By the time most retail investors noticed, the best entry points were already gone. This is why monitoring the Fear & Greed Index daily — not monthly — is critical during periods of elevated uncertainty.
March 9: Circuit Breakers and the First Extreme Fear Reading
March 9 was the day the markets truly cracked. The day opened with a 7% gap down — triggering Level 1 circuit breakers for the first time since 1997. Two catalysts hit simultaneously: Saudi Arabia launched an oil price war by flooding the market after OPEC talks collapsed, and COVID-19 case counts in Europe were surging.
The Fear & Greed Index hit 12 — Extreme Fear. The VIX exploded to 54.5. For experienced contrarian investors, this was a meaningful signal, but the market had not bottomed — not by a long shot.
March 16–23: The Abyss — Single-Digit Fear & Greed
The week of March 16 was unlike anything most living investors had experienced. On March 16 alone, the Dow Jones fell 2,997 points — its largest single-day point drop in history. The S&P 500 fell nearly 12% that Monday. The VIX hit 82.69, a reading surpassed only by the 89.53 peak of October 2008.
The Fear & Greed Index fell to 8 on March 16, and then to an extraordinary 3 on March 23 — the ultimate market bottom. At this exact moment:
- The S&P 500 stood at 2,237 — a 34% decline from its February peak
- The VIX was at 65 and had been above 40 for seven consecutive days
- Put/Call ratios were at crisis-level highs, indicating mass panic hedging
- Safe haven demand was extreme — 10-year Treasury yields had collapsed from 1.9% to 0.5%
A Fear & Greed reading of 3 is historically rare. In the 10-year history of the index, readings below 5 have occurred in only a handful of instances — and every single one marked a significant near-term market bottom.
"On March 23, 2020, the Fear & Greed Index was at 3 out of 100. Those who bought that day and held for one year were sitting on roughly +74% returns on the S&P 500. The signal was there. The courage to act on it was the hard part."
Why Did the Bottom Happen on March 23?
The Federal Reserve's actions were decisive. On March 23, the Fed announced unlimited quantitative easing — effectively promising to purchase as many Treasury bonds and mortgage-backed securities as needed to stabilize markets. This "whatever it takes" moment ended the freefall. Sentiment, which had priced in a complete financial system breakdown, was forced to recalibrate.
This is a crucial lesson: sentiment extremes don't cause the bottom — they signal that the conditions for a bottom are present. The actual trigger is often a policy response or a fundamental catalyst that breaks the cycle of panic selling.
April–June: The V-Shaped Recovery in Sentiment
The recovery in sentiment was almost as dramatic as its collapse. By April, the Fear & Greed Index had rebounded from 3 to the high 20s. By May, it sat in neutral territory. The S&P 500 gained 28% in April and May combined — the best two-month stretch in decades.
Many investors were skeptical of this recovery. The economic data was catastrophic: unemployment hit 14.7% in April, GDP fell 31.4% annualized in Q2, and earnings forecasts were slashed across the board. But markets are forward-looking, and with the Fed's backstop in place, sentiment was pricing in recovery — not current devastation.
August: New All-Time Highs — A Stunned Market
On August 18, 2020 — just 148 days after the March 23 bottom — the S&P 500 reached a new all-time high. The Fear & Greed Index was back in the 70s (Greed). This was perhaps the most disorienting moment for fundamental investors: how could markets be at record highs while unemployment remained at 10% and the pandemic raged?
The answer, once again, came down to liquidity and forward-looking sentiment. The Fed had injected trillions, fiscal stimulus was massive, and the market was pricing in vaccine development and eventual normalcy. Sentiment led the fundamentals by 6–9 months — as it almost always does.
November: Vaccine News and Extreme Greed Returns
On November 9, Pfizer announced 90%+ vaccine efficacy. The Fear & Greed Index surged into Extreme Greed territory (78+) virtually overnight. Value stocks, travel stocks, and energy shares exploded higher as the market rotated from pandemic winners to pandemic recovery plays.
By December 2020, the index was sitting at 80 — Extreme Greed — as year-end optimism combined with vaccine rollout news drove markets to finish the year up 16% despite one of the worst economic contractions in modern history.
Key Takeaways for Sentiment-Based Investors
- Speed matters: 2020 showed that sentiment can collapse from Greed to Extreme Fear in under three weeks. Daily monitoring is essential.
- Single-digit Fear & Greed readings are extremely rare buying opportunities: F&G below 5 has historically marked generational entry points.
- The bottom is only visible in hindsight, but extreme fear is a precondition: You cannot perfectly time the bottom, but buying in stages during Extreme Fear (F&G below 20) has historically produced strong 12-month returns.
- Recovery in sentiment leads recovery in fundamentals: Don't wait for the economic data to improve before buying. By then, the market has already priced it in.
- Policy catalysts break sentiment extremes: The March 23 bottom was triggered by Fed intervention. Knowing what can change the narrative is as important as reading the sentiment index itself.
Applying the 2020 Lessons with ThinqStock
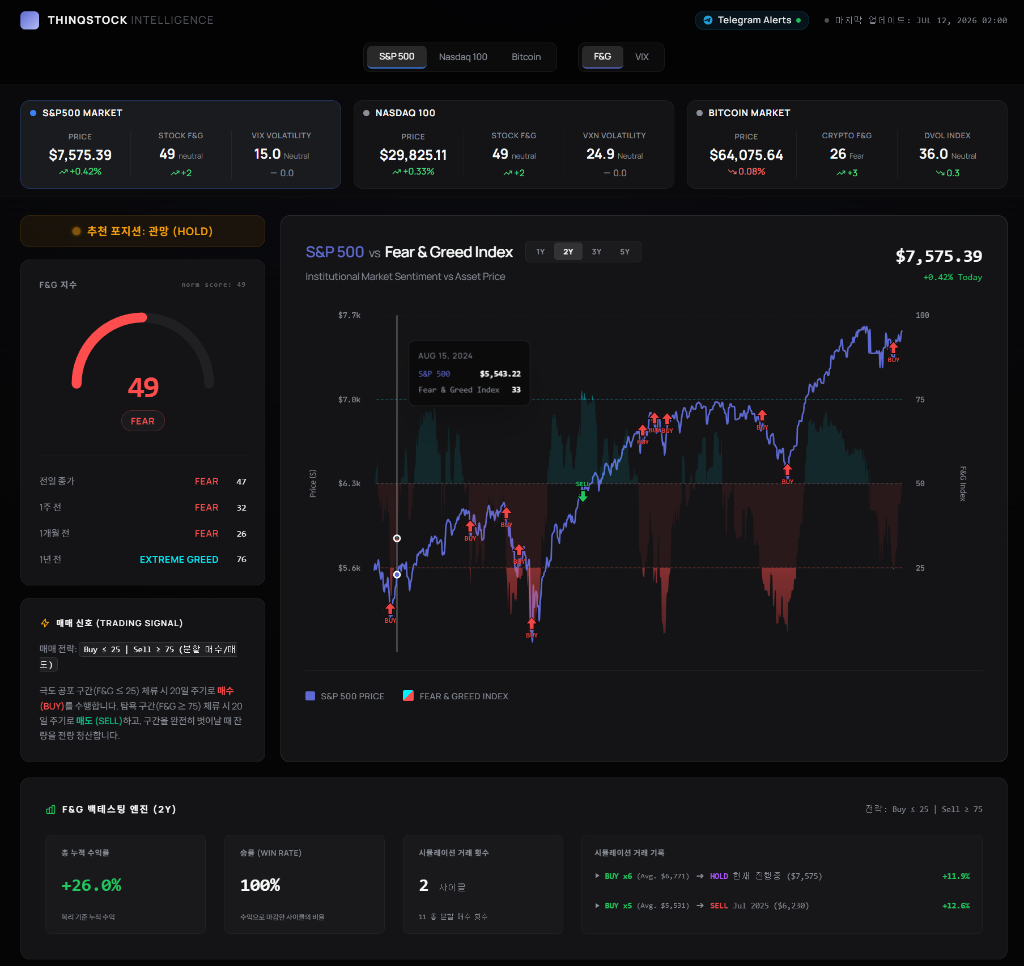
The ThinqStock backtesting engine lets you simulate exactly how a Fear & Greed-based strategy would have performed during the 2020 crash. By setting a buy threshold of 20 (Extreme Fear) and testing the 2019–2021 period, you can see the exact trade entries, exits, and comparative returns against a simple buy-and-hold approach. The data speaks for itself.
Comparing 2020 to 2008: Speed vs Depth
The 2020 crash was faster but shallower than 2008. The S&P 500 fell 34% in 33 days in 2020; in 2008–2009, it fell 57% over 517 days. Accordingly, Fear & Greed readings in 2008 stayed in Extreme Fear territory for months, while 2020's extreme fear window lasted only about two weeks at the absolute extreme.
This difference has major implications for strategy. In 2020, the window to buy at maximum fear was very narrow. Investors who waited for "more clarity" missed most of the recovery. In 2008, the window was longer — but the emotional durability required to buy repeatedly during 18 months of deteriorating news was much greater. The cooldown period in your strategy must be calibrated to the type of crash you're navigating.