DVOL Explained: Using Crypto Implied Volatility to Find Bitcoin Bottoms
For decades, equity investors have relied on the VIX—the CBOE Volatility Index—to gauge fear and complacency in the S&P 500. It is often dubbed the "fear gauge" of Wall Street. However, in the rapidly maturing cryptocurrency markets, traditional tools often fall short. Bitcoin operates on a 24/7 basis, unconstrained by market hours or traditional circuit breakers, making its price action far more explosive. To accurately measure sentiment and institutional hedging in crypto, professional traders have turned to a vastly superior metric: DVOL.
The Deribit Bitcoin Volatility Index (DVOL) is rapidly becoming the gold standard for crypto sentiment analysis. By quantifying the market's expectation of future volatility based on options pricing, DVOL provides a mathematical footprint of fear, greed, and capitulation. For investors willing to look beyond surface-level price charts, mastering DVOL is the key to identifying historic Bitcoin bottoms and avoiding catastrophic drawdowns.
What Exactly is DVOL?
DVOL measures the 30-day implied volatility of Bitcoin. It is calculated by aggregating the pricing data from the Deribit options exchange, which dominates global crypto options trading. When traders anticipate massive price swings—usually out of fear of a downside crash—they rush to buy protective put options. This surge in demand drives up the premium (price) of those options. DVOL mathematically extracts this premium expansion and outputs a single, easy-to-read annualized percentage.
If DVOL is sitting at 60%, it means the options market is pricing in an annualized expected move (up or down) of 60% over the next 30 days. Crucially, like the VIX, DVOL is heavily skewed toward downside fear. While extreme greed and blow-off tops can cause DVOL to rise, it absolutely explodes during panic selling.
"Because Bitcoin inherently possesses higher baseline volatility than traditional equities, its 'normal' DVOL range operates at a much higher baseline than the VIX. Understanding these specialized thresholds is critical."
Mapping the DVOL Zones
To effectively use DVOL as a trading signal, you must understand its historical ranges. A VIX reading of 40 would signal absolute chaos in the stock market; in the Bitcoin market, a DVOL of 40 often signals extreme, suffocating complacency.
| DVOL Range | Market State | Investor Psychology | Actionable Implication |
|---|---|---|---|
| 40% - 55% | Normal / Complacent | Apathy, sideways grinding | Accumulate spot slowly, sell covered calls |
| 55% - 75% | Elevated / Trending | Healthy bull run or mild fear | Trend following, watch for sudden spikes |
| 75% - 90% | Panic Zone | Fear taking over, weak hands selling | Prepare capital, look for bullish divergences |
| 90%+ | Capitulation | Absolute terror, forced liquidations | Generational buy opportunity (scale in) |
Historical Analysis: When DVOL Spiked
The true power of DVOL lies in its mean-reverting nature. Volatility cannot remain elevated infinitely. Eventually, the sellers run out of assets, the leveraged longs are fully liquidated, and the market runs out of panic. When DVOL spikes into the Capitulation zone, it almost always marks a structural bottom for Bitcoin.
| Event Timeline | Bitcoin Price Action | Peak DVOL Reading | Subsequent Recovery (6 Months) |
|---|---|---|---|
| March 2020 | COVID Crash (BTC drops to $3,800) | 160% | +185% |
| May 2021 | China Mining Ban crash | 140% | +95% (to new ATH) |
| June 2022 | Celsius/3AC Contagion | 95% | Market stabilized, slow accumulation |
| November 2022 | FTX Collapse | 82% | +80% (birth of 2023 bull run) |
The March 2020 COVID crash represents the highest DVOL spike in recorded history, hitting an astonishing 160%. Investors who bought the exact moment DVOL peaked secured Bitcoin at under $4,000. Similarly, during the dark days of November 2022, when the FTX exchange collapsed and mainstream media declared crypto dead, DVOL spiked to 82%. This massive surge in implied volatility signaled that the final flush of leverage was complete. Within weeks, Bitcoin had formed a macro bottom around $15,500 and began its relentless march back upward.
The Mechanics of a DVOL Spike: Liquidation Cascades
Why does DVOL spike so violently? It is the result of crypto's unique market structure, heavily reliant on derivative leverage. During a sharp downturn, traders who have bought Bitcoin on margin face margin calls. If they cannot post additional collateral, the exchange's risk engine automatically liquidates their position, forcefully selling their Bitcoin at market price. This forceful selling drives the price down further, triggering the next batch of liquidations. This feedback loop is known as a liquidation cascade.
As this cascade accelerates, institutional players and market makers rush to the options market to buy puts, desperate to hedge their exposure. This frantic demand sends DVOL vertical. The spike in DVOL is literally the mathematical measurement of a liquidation cascade happening in real-time. Once the cascade finishes—because all the leveraged longs have been wiped out—DVOL collapses, and the price naturally bounces.
Combining DVOL with the Crypto Fear & Greed Index
While DVOL measures institutional options pricing, the standard Crypto Fear & Greed Index incorporates broader retail sentiment metrics like social media volume, Google search trends, and market momentum. The most powerful buy signals occur when these two indicators align perfectly. If the Crypto Fear & Greed Index drops below 15 (Extreme Fear) on the exact same day that DVOL spikes above 85%, you are witnessing total synchronized capitulation across both retail and institutional cohorts. This is the definition of a high-probability asymmetric setup.
Why DVOL Spikes Mean-Revert
The foundational principle of trading volatility is mean reversion. High volatility acts like a stretched rubber band. The energy required to maintain implied volatility at 100% is immense. It requires constant, relentless panic and continuous streams of terrible news. Humans simply cannot sustain that level of panic indefinitely. Apathy inevitably sets in. When the fear subsides, the premium on options collapses. As market makers adjust their hedges, this collapse in volatility often fuels a sharp, violent rally in the underlying price of Bitcoin. You are effectively betting on the return of human rationality.
A Practical Entry Strategy Using DVOL
If you wish to integrate DVOL into your crypto accumulation strategy, avoid trying to catch falling knives blindly. Instead, implement a rules-based system:
- Monitor the Baseline: Ignore minor fluctuations when DVOL is between 40% and 60%. This is noise.
- The Alert Phase: When DVOL crosses 75%, put your capital on standby. A significant liquidation event is occurring.
- The Peak Search: Do not buy immediately. Wait for DVOL to stop rising and print a lower daily close. The cresting of the DVOL wave is your entry signal.
- Scale the Entry: Deploy 50% of your allocated capital on the initial DVOL crest. If a secondary wave of panic hits, use the remaining 50% to average down.
Utilizing ThinqStock for Volatility Analysis
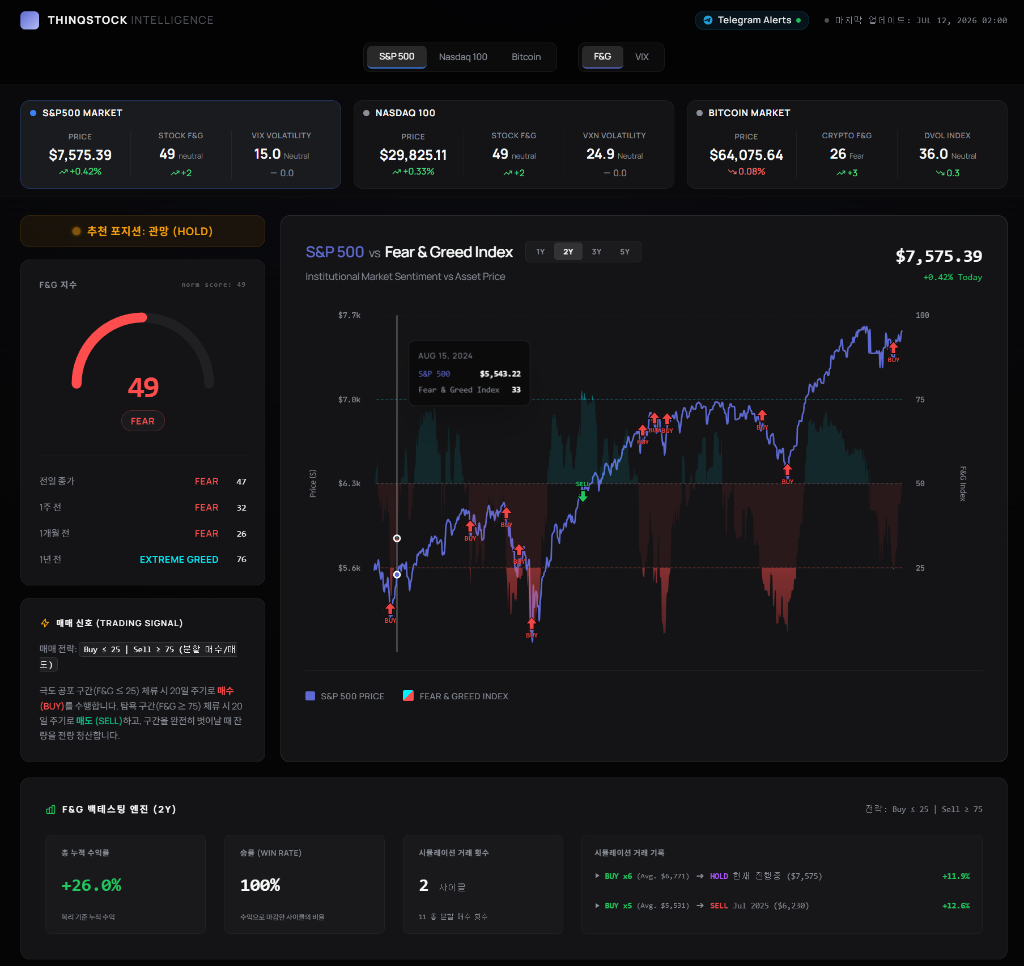
Tracking complex options metrics across multiple exchanges can be daunting. The ThinqStock platform simplifies this by aggregating DVOL data alongside our proprietary suite of sentiment indicators. Our dashboard allows you to overlay DVOL directly onto the Bitcoin price chart, illuminating the exact moments of historical capitulation. Furthermore, ThinqStock provides real-time alerts when DVOL enters the critical 75%+ Panic Zone, ensuring you are prepared to act when the rest of the market is paralyzed by fear.
Understanding and respecting the Deribit Bitcoin Volatility Index transforms crypto investing from a game of blind speculation into a disciplined, data-driven practice. By waiting patiently for the inevitable spikes in panic, you align yourself with the mathematical realities of the market, turning the crowd's fear into your greatest advantage.