Extreme Greed Zone (75+): Recognizing the Top Before It Happens
There is no environment more intoxicating in the financial markets than the Extreme Greed zone. When the Fear & Greed Index crosses the critical threshold of 75, the financial media turns universally bullish, retail participation skyrockets, and it feels as though every trade you make turns instantly to gold. This is the precise moment when the invisible trap is set. While the allure of endless gains is powerful, the reality is that extreme greed is the market's ultimate warning light. It signifies a precarious state of over-leverage, complacency, and psychological euphoria that historically precedes devastating corrections.
Recognizing a market top before it happens is widely considered impossible by passive investors. However, for those equipped with the right analytical tools and an understanding of mass psychology, the signs are glaringly obvious. The transition from a healthy bull market to a speculative bubble leaves distinct footprints in the sentiment data. This guide unpacks the mechanics of extreme greed, reviews historical blow-off tops, and provides a concrete framework for protecting your capital when the crowd loses its collective mind.
The Psychology of Market Tops: Euphoria and FOMO
To understand why the Extreme Greed zone is so dangerous, you must first understand the psychological forces driving it. A market top is rarely an event; it is a process. It begins with rational optimism based on improving fundamentals. As prices rise, early investors reap rewards. This attracts a second wave of capital. By the time the Fear & Greed Index crosses 75, the narrative has shifted entirely from valuation-based investing to pure price momentum.
This final phase is characterized by intense Fear Of Missing Out (FOMO). Retail investors, witnessing friends and colleagues generating massive returns, capitulate and flood the market with capital. Margin debt expands exponentially as speculators borrow heavily to amplify their gains. The psychological pain of sitting in cash while the market soars 2% a day becomes unbearable. This collective capitulation into risk assets absorbs all the available liquidity in the system. When everyone is fully invested, there is no one left to buy. The market becomes a towering Jenga block, ready to topple at the slightest breeze of bad news.
"Bull markets are born on pessimism, grown on skepticism, mature on optimism, and die on euphoria. The reading of 75+ is the mathematical quantification of euphoria."
Historical Analysis: Major Extreme Greed Episodes
History provides profound lessons on the consequences of ignoring extreme sentiment. A review of major market tops over recent years reveals a striking consistency: severe market corrections almost exclusively originate from the Extreme Greed zone.
| Timeframe | Peak F&G Reading | Market Context | Subsequent Correction |
|---|---|---|---|
| Jan 2018 | 95 (Extreme Greed) | "Volmageddon" blow-off top | -10.2% in 2 weeks |
| Jan 2020 | 94 (Extreme Greed) | Pre-pandemic melt-up | -34% (COVID crash) |
| Feb 2021 | 92 (Extreme Greed) | Meme-stock and SPAC mania | -13% tech sector rot |
| Nov 2021 | 90 (Extreme Greed) | Post-stimulus euphoria peak | Bitcoin -55%, S&P -20% |
| Jan 2022 | 76 (Extreme Greed) | Final gasp before rate hikes | -28% bottoming in June |
Look closely at the data table above. In January 2018, the index hit a staggering 95. The market was universally bullish on the back of corporate tax cuts. Two weeks later, the VIX exploded in what became known as "Volmageddon," wiping out 10.2% of the S&P 500's value almost overnight. Similarly, in November 2021, when both crypto and equities hit their zenith, the sentiment reading of 90 signaled absolute euphoria. The subsequent unwinding took a devastating toll on portfolios worldwide.
The 5 Warning Signs of Dangerous Greed
A high Fear & Greed reading alone does not mean the market will crash tomorrow. A strong bull market can remain in the Greed or low-Extreme Greed zone (65-80) for months. The danger arises when extreme readings are coupled with structural deterioration. Here are the five critical warning signs to monitor:
- Collapsing Breadth: The index is making new highs, but the number of stocks participating is shrinking. If the S&P 500 is up, but the equal-weight index is down, the rally is hollow.
- Explosive Call Option Volume: When retail investors aggressively buy short-dated, out-of-the-money call options, it forces market makers to buy the underlying stock, creating a gamma squeeze. This is highly unstable and characteristic of final blow-off tops.
- Junk Bond Demand Peaks: When investors accept historically low yields on high-yield (junk) bonds, it signifies a complete disregard for credit risk in the pursuit of marginal returns.
- VIX Complacency: The VIX (Volatility Index) dropping below 12 while equities are at all-time highs suggests market participants have stopped buying protective puts. They believe a crash is impossible.
- Mainstream Media Capitulation: When financial magazines run cover stories about the "endless bull market" or when your Uber driver starts pitching penny stocks, the psychological cycle is complete.
The Critical Difference: Greed vs. Extreme Greed
It is vital to distinguish between normal Greed (55-74) and Extreme Greed (75+). Normal greed is the healthy fuel of a durable bull market. It represents steady capital inflows, corporate share buybacks, and solid earnings growth. You want to be fully invested during normal greed. Extreme greed, however, is parabolic and unsustainable. It is characterized by vertical price charts, margin debt explosions, and retail mania. Recognizing the transition between the two is the key to preserving wealth.
Combining Fear & Greed with VIX Complacency
One of the most potent risk management strategies is combining the Fear & Greed Index with a close analysis of the VIX. The VIX measures the implied volatility of S&P 500 options—essentially, how much insurance investors are buying against a market drop. In a healthy bull market, the VIX trends slowly downward. However, in the late stages of an extreme greed bubble, a terrifying divergence often occurs: the S&P 500 continues to rise, but the VIX stops falling and begins to slowly creep higher.
This phenomenon means that while retail investors are blindly buying the top, institutional "smart money" is quietly accumulating downside protection. If you observe the Fear & Greed Index above 85 while the VIX simultaneously begins to rise from its lows, you are staring at a structural fault line. A severe correction is highly probable within a matter of weeks.
Risk Management: Scaling Out and Position Sizing
So, how should you react when the alarm bells are ringing? The worst mistake an investor can make is to abruptly liquidate their entire portfolio. Predicting the exact day of a market top is impossible, and extreme greed can persist longer than rational thought would suggest. Instead, the appropriate response is tactical scaling.
When the Fear & Greed Index crosses 75, initiate Phase 1 of risk mitigation. Stop deploying fresh capital into high-beta or speculative growth stocks. Redirect dividends or new savings into cash equivalents or short-term treasuries.
If the index crosses 85, initiate Phase 2. Begin selectively trimming your biggest winners. If a stock has gone parabolic and is stretched 30% above its 200-day moving average, sell a quarter or a third of the position. You are not trying to call the top; you are simply harvesting crops that have grown exceptionally tall.
If the index exceeds 90, accompanied by the warning signs listed above, tighten trailing stop-losses across your entire portfolio. Raise cash levels significantly. The goal here is not to maximize the last 3% of the bull market, but to ensure you have immense dry powder available when the inevitable 20% correction occurs.
The Perils of Shorting Extreme Greed
A common fallacy among aggressive traders is assuming that a Fear & Greed reading of 95 is a screaming signal to short the market. This is exceptionally dangerous. The famous adage states: "The market can remain irrational longer than you can remain solvent." During a blow-off top, momentum algorithms and short squeezes can drive prices to levels that defy all fundamental logic.
Shorting requires perfect timing, whereas reducing long exposure and moving to cash only requires good judgment. If you short early and face margin calls, you will be forced to buy back your position at the exact top, fueling the final spike before the crash. Use extreme sentiment as a shield to protect your gains, not as a sword to blindly attack a raging bull.
Utilizing ThinqStock to Monitor the Danger Zone
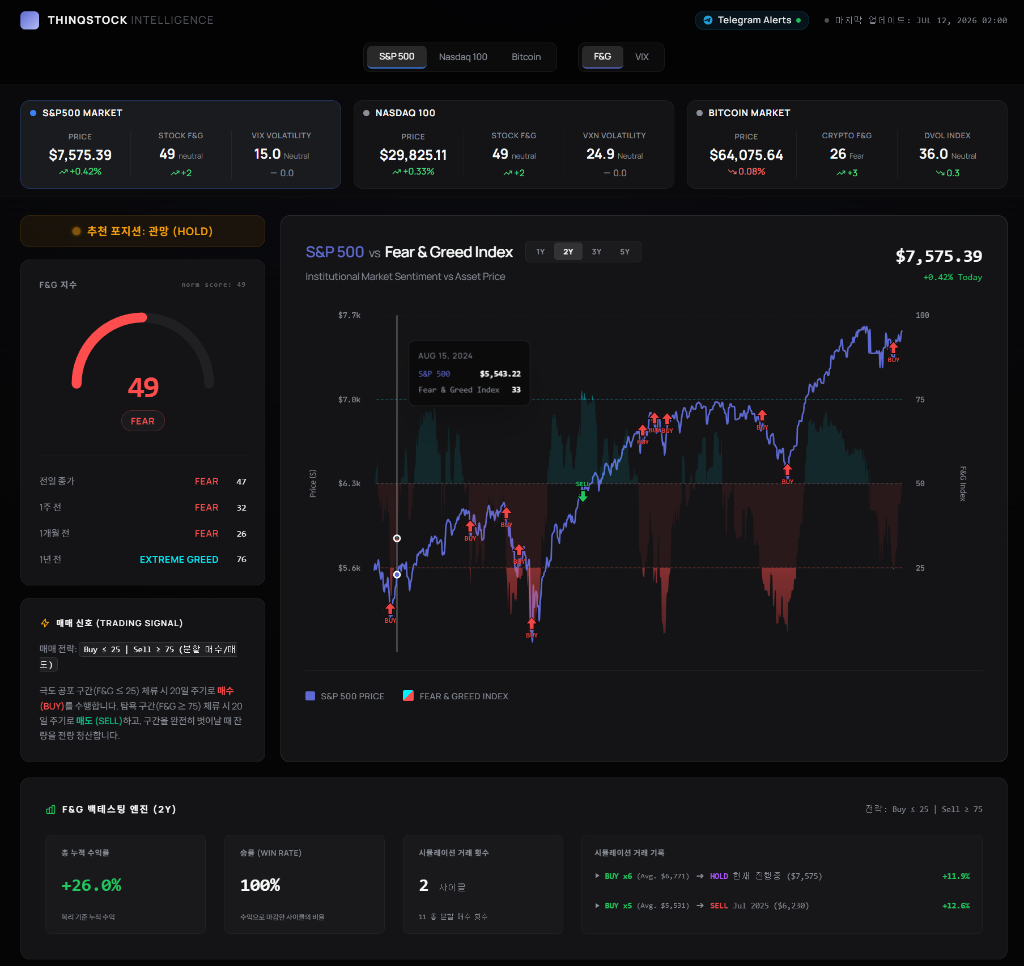
The ThinqStock platform provides unparalleled visibility into these market dynamics. Our dashboard doesn't just show you a dial; it breaks down the components of greed. You can monitor the precise levels of safe-haven demand, junk bond spreads, and options activity that are driving the composite score. When the market enters the Extreme Greed zone, ThinqStock's historical overlay tool allows you to instantly compare current conditions against past blow-off tops like Jan 2018 or Nov 2021, helping you contextualize the risk objectively without falling victim to the prevailing market euphoria.
Final Thoughts
Navigating the Extreme Greed zone requires immense psychological discipline. You must be willing to look foolish in the short term, missing out on the final, dizzying days of a parabolic rally, in order to protect your capital from the brutal reality check that inevitably follows. By understanding the mechanics of market tops, respecting the historical data, and utilizing systematic risk management, you can step aside when the crowd goes mad, patiently waiting to deploy your preserved capital when extreme fear returns.