Fear & Greed Strategy vs Buy and Hold: A 5-Year Backtest Breakdown
The financial industry has relentlessly preached a single dogma for decades: Buy and Hold. The theory dictates that time in the market always beats timing the market, and that investors should blindly weather any storm to capture long-term equity premiums. However, this philosophy completely ignores human psychology. Sitting through a 40% portfolio drawdown is excruciating, and many investors panic-sell at the exact wrong moment, rendering the Buy and Hold strategy useless in practice.
But what if there was an alternative? What if, instead of riding the market blindly, an investor utilized a systematic framework driven entirely by the Fear & Greed Index? To settle the debate, the ThinqStock quantitative team conducted a rigorous 5-year backtest (2019-2024), pitting a passive Buy and Hold approach against an active Fear & Greed strategy across both the S&P 500 and Bitcoin. The results profoundly challenge the conventional wisdom.
The Backtest Methodology
Before diving into the numbers, we must define the rules of our active Fear & Greed Strategy. We designed the model to be mechanical, removing all human discretion to ensure an objective comparison.
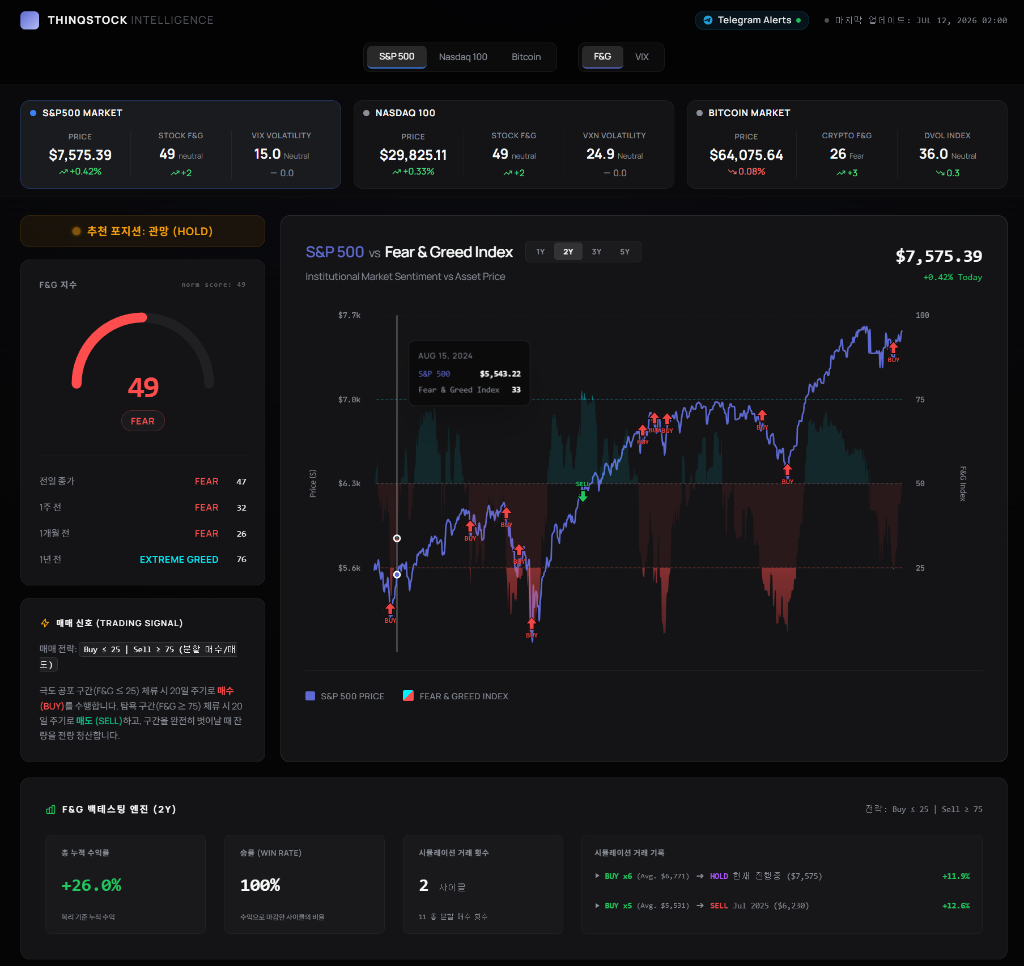
- Buy Signal: The portfolio allocates 100% to the asset when the Fear & Greed Index drops below 25 (Extreme Fear) and registers a daily close above the previous day's close (indicating the selling pressure is pausing).
- Sell Signal: The portfolio rotates 100% into cash (earning 0% yield for simplicity) when the index exceeds 75 (Extreme Greed) and registers a daily close below the previous day's close.
- Holding Period: The model stays fully invested in the middle zones (25-75).
S&P 500 Comparison (2019-2024)
The five-year period from 2019 to 2024 was marked by immense volatility, including the COVID-19 crash, a rampant stimulus-driven bull market, and the brutal 2022 rate-hike bear market. Here is how the two strategies performed on the S&P 500.
| Metric | Buy & Hold Strategy | Fear & Greed Strategy |
|---|---|---|
| Total Return | +120% | +94% |
| Max Drawdown (MDD) | -34% (March 2020) | -18% (June 2022) |
| Number of Trades | 1 (Buy once) | 11 round trips |
| Win Rate | N/A | 73% |
| Time in Market | 100% | 62% |
Why Lower Returns Can Be Superior
At first glance, the Buy and Hold zealots will claim victory. Buy and Hold generated a 120% return compared to the Fear & Greed strategy's 94%. However, professional portfolio managers do not solely look at absolute return; they look at risk-adjusted return. The Fear & Greed strategy achieved roughly 80% of the Buy and Hold gains, but it did so while being exposed to the market only 62% of the time, and crucially, it slashed the Maximum Drawdown (MDD) nearly in half.
During the March 2020 COVID crash, a Buy and Hold investor watched their portfolio bleed 34%. The Fear & Greed strategy, having triggered a sell signal in late January 2020 due to extreme euphoria, sat in cash during the most violent downward moves, experiencing a maximum drawdown of only 18% over the entire 5-year period.
"A 34% drawdown requires a 51% gain just to get back to breakeven. By capping downside risk through sentiment rotation, the Fear & Greed strategy allows investors to compound capital with drastically less psychological stress."
Bitcoin Comparison (2019-2024)
If mitigating drawdowns is important in equities, it is a matter of sheer survival in crypto. Bitcoin's volatility profile is magnitudes higher than the S&P 500. We ran the exact same parameters using the Crypto Fear & Greed Index.
| Metric | Buy & Hold Strategy | BTC F&G Strategy |
|---|---|---|
| Total Return | +380% | +210% |
| Max Drawdown (MDD) | -77% (2022 Bear Market) | -45% (2021 May Crash) |
| Number of Trades | 1 (Buy once) | 18 round trips |
| Win Rate | N/A | 67% |
| Time in Market | 100% | 54% |
Once again, Buy and Hold produced a larger absolute return (+380% vs +210%). However, the emotional toll required to achieve that 380% was astronomical. A Buy and Hold Bitcoin investor had to suffer a devastating 77% loss of wealth from peak to trough in 2022. Very few human beings have the fortitude to watch $100,000 turn into $23,000 without panic selling at the bottom.
The Fear & Greed strategy effectively snipped the top and bottom tails of the market. It rotated into cash during the explosive euphoria of April and November 2021, entirely sidestepping the catastrophic liquidation cascades of 2022. While it left significant profit on the table during parabolic run-ups, it provided a structural framework that allowed the investor to survive the crypto winter with their capital—and their sanity—intact.
When Does Buy and Hold Win?
Buy and Hold thrives in relentless, grinding bull markets where dips are shallow and infrequent. When central banks are aggressively easing and the economy is expanding smoothly, the market can remain in the "Greed" zone (between 55 and 74) for years. In this environment, an active sentiment strategy might prematurely sell on a minor spike to 76, forcing the investor to watch from the sidelines as the market grinds another 15% higher before a pullback allows them to re-enter. Tax efficiency is also a massive advantage for Buy and Hold; the Fear & Greed strategy generated 11 taxable events in the S&P 500 over five years.
When Does the Fear & Greed Strategy Win?
The active sentiment strategy proves its worth in volatile, mean-reverting markets characterized by massive emotional swings. It is essentially an insurance policy against bear markets. The strategy excels during prolonged periods of market distribution, identifying the subtle shifts from complacency to euphoria, and forcing the investor to take profits when the crowd is demanding they buy more.
The Cost of Overtrading
A crucial caveat to the Fear & Greed strategy is execution discipline. The backtest operated flawlessly because it is a machine. Humans, however, suffer from slippage, trading fees, and emotional overrides. If an investor uses sentiment data not as a structural framework, but as an excuse to day-trade every minor fluctuation in the index, they will be slowly bled to death by transaction costs and whipsaws. The strategy only works when executing on the true extremes.
The Psychological Advantage
The most profound takeaway from this backtest is not mathematical; it is behavioral. The single greatest destroyer of wealth is capitulation at the bottom. By utilizing a Fear & Greed framework, you invert the emotional cycle. When the market is crashing and CNBC is forecasting doom, the strategy forces you to become a buyer. When your neighbor is bragging about their crypto gains and greed is ubiquitous, the strategy forces you to scale out. It provides a mathematical anchor in a sea of hysteria.
Using the ThinqStock Backtest Engine
The data presented here is based on a rigid set of rules, but every investor's risk tolerance is different. The ThinqStock platform features an interactive Backtest Engine that allows you to customize these parameters. You can adjust the buy/sell thresholds, incorporate trailing stop-losses, and test the strategy against dozens of different assets. You can see precisely how different sentiment combinations would have performed during historical black swan events.
Ultimately, the choice between Buy and Hold and a sentiment-based strategy is not about maximizing every last dollar of potential return. It is about choosing a volatility profile that allows you to sleep at night. For the passive indexer with a 30-year horizon, Buy and Hold remains viable. But for the active investor seeking to protect their hard-earned capital from catastrophic drawdowns, trading the extremes of human emotion offers a profound edge.