How to Trade Using the Fear & Greed Index
Investing in financial markets is often driven by two primary emotions: Fear and Greed. When asset prices surge, investors get greedy, leading to FOMO (Fear Of Missing Out). Conversely, when prices plunge, fear takes over, causing irrational sell-offs. Understanding these sentiment cycles is the key to maximizing your investment returns.
"Be fearful when others are greedy, and greedy when others are fearful." — Warren Buffett
What is the Fear & Greed Index?
The Fear & Greed Index measures investor sentiment on a scale from 0 to 100. It indicates whether the market is currently overvalued (due to excessive optimism) or undervalued (due to excessive pessimism).
- 0 to 25 (Extreme Fear): Investors are extremely anxious, often selling off assets below their intrinsic value. Historically, this represents prime buying opportunities.
- 26 to 74 (Neutral): The market is in equilibrium, showing stable, non-emotional trading activity.
- 75 to 100 (Extreme Greed): Excessive bullishness dominates, driving valuations to unsustainable heights. This is a high-risk zone prone to corrections.
The Core Trading Strategy
By leveraging the sentiment scores, you can build a systematic, emotionless trading plan. The core rules are straightforward:
- Buy the Fear (Accumulation Zone): When the sentiment index drops to 25 or lower, start accumulating assets. This is when the market is pricing in worst-case scenarios, offering a margin of safety.
- Sell the Greed (Distribution Zone): When the sentiment index hits 75 or higher, begin taking profits or increasing your cash reserves. The market is overextended, and the probability of a pullback is high.
- Apply a Cooldown Period: Markets can remain in extreme zones for days or weeks. To avoid over-trading, apply a cooldown period (e.g., 20 days) between consecutive buy or sell signals.
Using the ThinqStock Dashboard
The ThinqStock Dashboard simplifies this analysis by integrating Stock (S&P 500) and Crypto (Bitcoin) sentiment data into a single, unified interface.
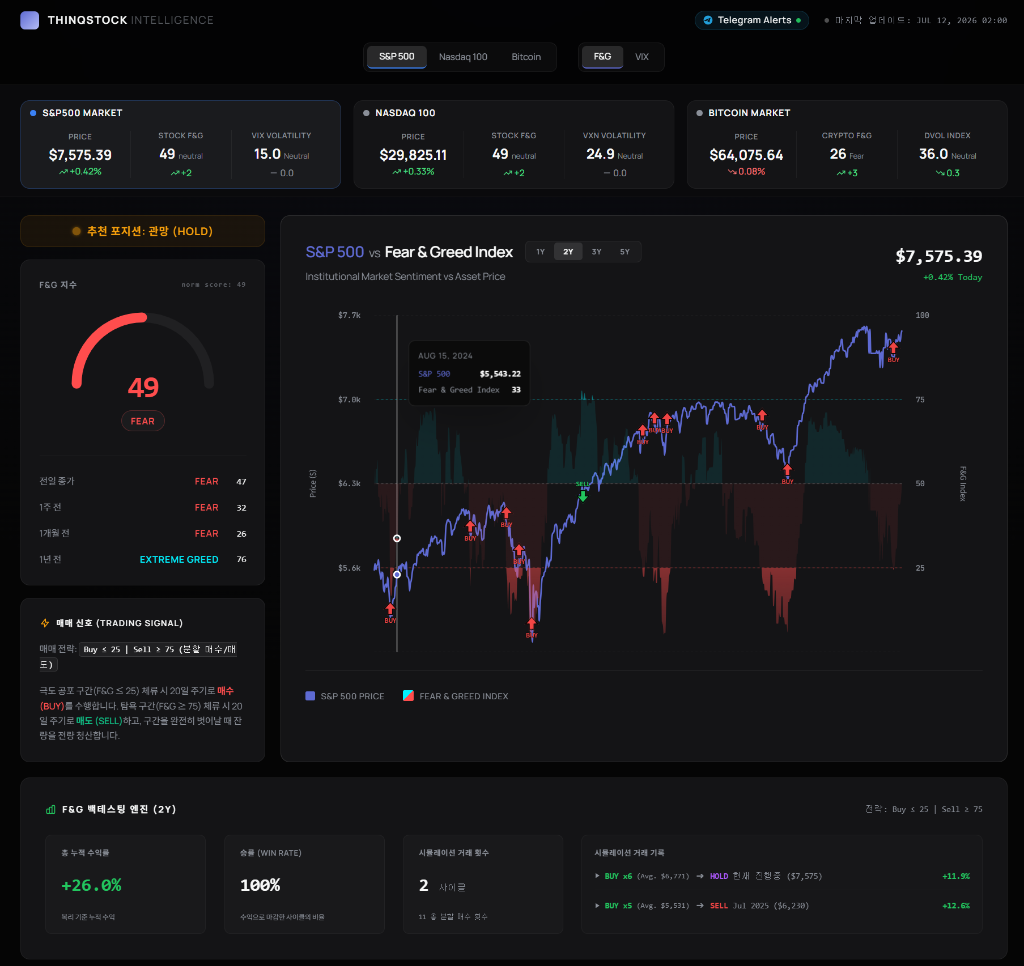
- Overlay Charts: View the asset price plotted directly alongside historical sentiment bands. This lets you visually identify how previous price bottoms aligned with extreme fear zones.
- Backtesting Engine: Evaluate the performance of the Fear & Greed strategy dynamically. Check the cumulative returns, win rates, and simulated trade logs over different timeframes (1Y, 2Y, 3Y, 5Y) to confirm the strategy's validity before risking real capital.