Introducing ThinQStock: Timing the Market with Quant-Backed Sentiment Analysis
If you have ever traded stocks or cryptocurrencies, you have likely asked yourself the age-old question: "Is now the right time to buy?"
Staring at price charts that constantly fluctuate up and down in red and blue makes it incredibly difficult to judge whether the market is currently at a peak (high point) or a trough (low point). You might have even experienced the frustration of Murphy’s Law—where the market drops the moment you buy, and rallies the moment you sell.
So, what do successful investors look at to time their entries? Instead of relying on raw emotions or intuition, professional investors look at quantitative sentiment indicators that measure market fear and greed—such as the Fear & Greed Index (F&G), VIX, and DVOL. We are excited to introduce ThinQStock, a powerful platform designed to help you monitor these indicators and scientifically backtest your investment strategies.

What is ThinQStock?
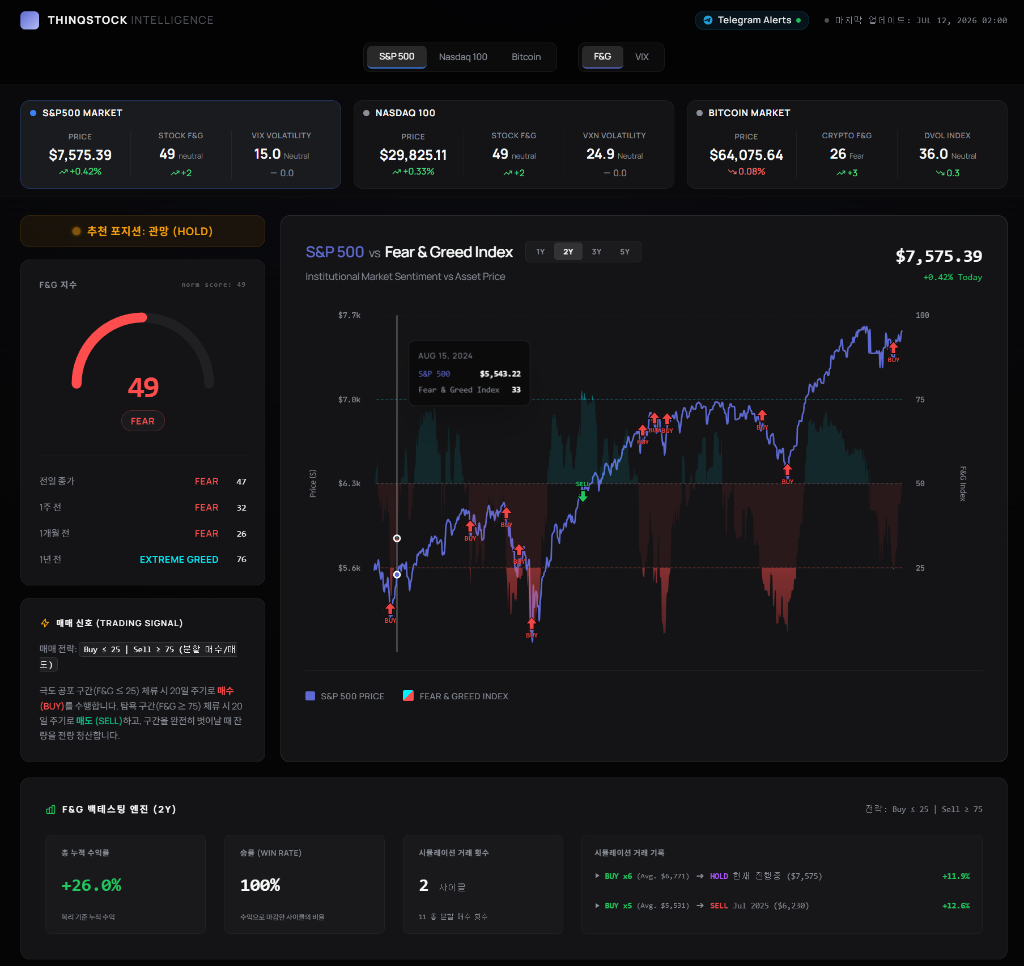
ThinQStock is a financial analytics platform that visualizes market sentiment for global equities (S&P 500) and cryptocurrencies (Bitcoin), backed by a real-time historical backtesting engine. Unlike generic sentiment tools that only show today's score, ThinQStock answers the critical question: "What were the historical returns when buying at this exact sentiment level?" By providing empirical, statistical evidence, it helps you make rational, data-driven investment decisions.
4 Core Features of ThinQStock
1. Dual-Asset Class Cross Analysis (Stocks & Crypto)
Switch seamlessly between the stock and crypto dashboards with a single toggle control to compare market regimes:
- Stock Market: Monitor the S&P 500 Index, the Nasdaq 100 Index, the Fear & Greed Index (F&G), and the VIX/VXN (Volatility Index) side-by-side.
- Crypto Market: Monitor Bitcoin (BTC) price, the Crypto Fear & Greed Index, and the option-implied volatility gauge DVOL (Deribit Volatility Index).
2. Price & Sentiment Correlation Chart (Combined Correlation Chart)
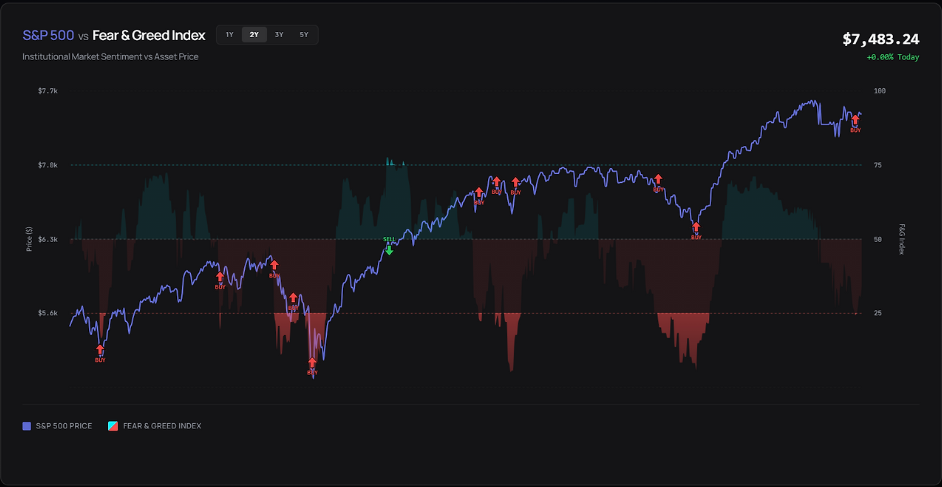
ThinQStock merges asset price action with sentiment indicators onto a single, integrated multi-axis chart. The chart automatically highlights zones of Extreme Fear (Green Shading - Buying Opportunities) and Extreme Greed (Red Shading - Selling Opportunities). This lets you visually confirm how accurately historical bottoms and tops align with extreme investor sentiment.
3. Data-Driven Backtesting Panel (Backtest Panel)

This panel answers the age-old question: "What if I bought every time the Fear & Greed Index dropped below 20?" It simulates strategies over 1-year, 3-year, and 5-year historical windows to display key quant metrics—such as Win Rate, Average Return, and Maximum Drawdown (MDD)—in a transparent table.
4. Normalized Volatility Metrics
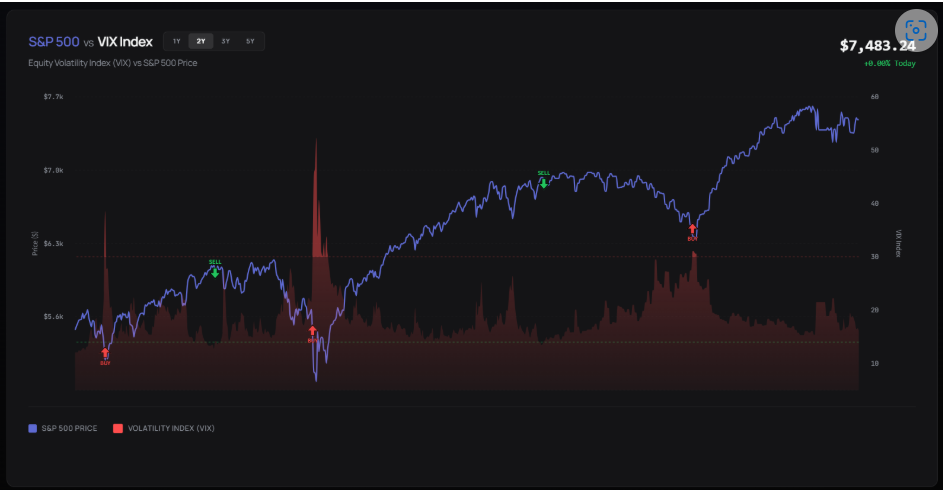
Market volatility gauges like VIX and DVOL have different raw scales and dynamics. ThinQStock utilizes a custom mathematical algorithm to normalize these values into a unified 0–100 scale, allowing for direct comparison against standard Fear & Greed scores. We also provide full multilingual support (English and Korean) for global investors.
📈 Practical Guide: How to Trade Sentiment with ThinQStock
-
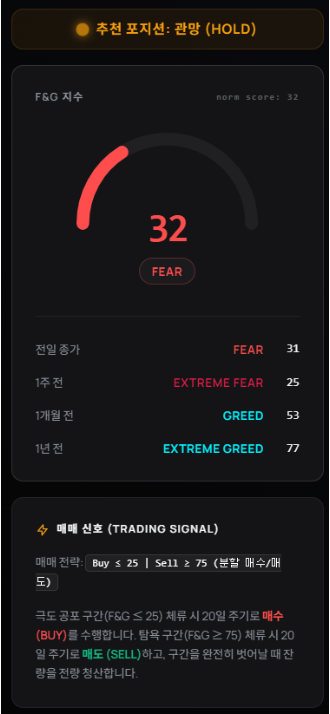
Step 1: Check Current Market Rating: Look at the main gauge on the homepage. If it points to Extreme Fear (0-25), it indicates panic selling and potential accumulation opportunities. If it points to Extreme Greed (75-100), the market is complacent, signaling a good time to manage risk or take profit.
- Step 2: Review Backtest Statistics: Check the backtesting panel to see the historical win rate and drawdown for the current sentiment band before executing trades.
- Step 3: Analyze Chart Divergences: Watch for divergences on the correlation chart—such as price hitting new lows while the sentiment index starts forming higher lows, which often precedes a trend reversal.
Get Started with ThinQStock Today
Stop guessing and making emotional trades based on chaotic price charts. Visit ThinQStock now to access real-time sentiment gauges, advanced correlation charts, and quant-backed backtesting data!