Max Drawdown Explained: The Risk Metric That Really Matters
When novice investors evaluate a trading strategy, their eyes immediately gravitate toward the single most seductive number on the page: the total percentage return. They dream of exponential growth and massive compound interest. However, professional algorithmic traders, hedge fund managers, and seasoned investors rarely look at total return first. The very first metric they analyze to determine if a strategy is viable is the Maximum Drawdown (MDD).
Why? Because a strategy that promises a 200% return is completely useless if it requires you to sit through an 80% loss to get there. Human psychology simply will not tolerate it. In this guide, we will dissect exactly what Maximum Drawdown is, the brutal mathematics of portfolio recovery, and how utilizing the Fear & Greed Index systematically through ThinqStock can drastically reduce your exposure to catastrophic drawdowns.
The MDD Formula: What Does It Measure?
Maximum Drawdown measures the largest single percentage drop in your portfolio from its highest peak to its lowest trough, before a new peak is achieved. It represents the absolute worst-case scenario you would have experienced if you had bought at the absolute top and sold at the absolute bottom during a specific period.
MDD = (Trough Value - Peak Value) / Peak Value
If your portfolio grows steadily to $100,000, then crashes down to $60,000 during a bear market, before eventually recovering to $110,000 over the next two years, your Maximum Drawdown for that period is -40%. It does not matter that you eventually hit a new all-time high; the MDD permanently records the deepest wound your portfolio sustained.
“Drawdowns do not just destroy capital; they destroy time. A massive drawdown can force your portfolio to spend years just breaking even, completely halting the compounding process.”
The Brutal Mathematics of Recovery
To truly respect MDD, you must understand the asymmetry of percentage losses and percentage gains. This is a mathematical law that traps countless unprepared investors. A 10% loss requires an 11% gain to recover. A 20% loss requires a 25% gain to recover. But as the drawdown deepens, the required recovery rate grows exponentially.
| Portfolio Drawdown | Required Gain to Break Even | Realistic Time to Recover (at 10% annual return) |
|---|---|---|
| -10% | +11.1% | 1.1 Years |
| -15% | +17.6% | 1.7 Years |
| -25% | +33.3% | 3.0 Years |
| -50% | +100.0% | 7.3 Years |
| -56.8% (2008 S&P 500) | +131.0% | 8.8 Years |
| -80% | +400.0% | 16.9 Years |
If you experience a 50% drawdown, your remaining capital must double just to get you back to zero. Finding an investment that doubles in value is incredibly difficult and takes years. This mathematical reality is why preserving capital during bear markets is far more important than outperforming during bull markets.
Comparing MDDs: Buy & Hold vs. Sentiment Strategies
The core proposition of incorporating the Fear & Greed Index into your trading is not necessarily to beat the market's raw return every single year. The primary objective is to radically reduce the depth of your drawdowns by sidestepping the worst phases of market panics and only deploying capital when the statistical edge is overwhelmingly in your favor.
Let's look at historical data comparing a standard "Buy & Hold" approach versus an optimized "Fear & Greed Strategy" across different assets and major crash events.
| Asset & Market Event | Buy & Hold MDD | F&G Strategy MDD |
|---|---|---|
| S&P 500: 2008-2009 Financial Crisis | -56.8% | -28.0% |
| S&P 500: 2020 COVID Crash | -33.9% | -18.0% |
| S&P 500: 2022 Inflation Bear Market | -25.4% | -14.0% |
| Bitcoin (BTC): 2018 Crypto Winter | -83.0% | -48.0% |
| Bitcoin (BTC): 2022 Crypto Crash | -77.0% | -41.0% |
In the catastrophic 2008 financial crisis, a Buy & Hold investor in the S&P 500 suffered a soul-crushing -56.8% drawdown. However, a properly calibrated sentiment strategy (which raises cash during excessive greed and only buys aggressively when fear peaks) effectively cut that drawdown in half to -28%. In highly volatile assets like Bitcoin, the ability of a sentiment model to reduce an 83% catastrophic loss down to a manageable 48% drawdown is the difference between surviving the cycle and being wiped out completely.
The Psychology of Deep Drawdowns and Strategy Adherence
The most significant danger of a high MDD is not the math; it is the psychological break it causes in the investor. Every trading strategy, no matter how robust on paper, has an implicit "pain threshold."
If you backtest a strategy that shows a 50% max drawdown, you might convince yourself you can handle it. "I'll just hold through the pain," you tell yourself. However, living through a 50% drawdown in real-time is agonizing. It means logging into your brokerage account every day for 14 months and watching your life savings evaporate. You will question the strategy, the market, and yourself. Eventually, at the absolute worst possible moment (peak fear), you will capitulate, manually override the strategy, and sell everything at the bottom.
The Adherence Principle
A strategy is only profitable if you can mentally adhere to it during its worst drawdown. By systematically limiting your MDD to 15% or 20% using sentiment indicators, you prevent the emotional panic that causes investors to abandon their rules. A slightly lower total return with a tightly controlled MDD is vastly superior to a high-return system that routinely suffers 40% drops.
Using ThinqStock to Compare and Control MDDs
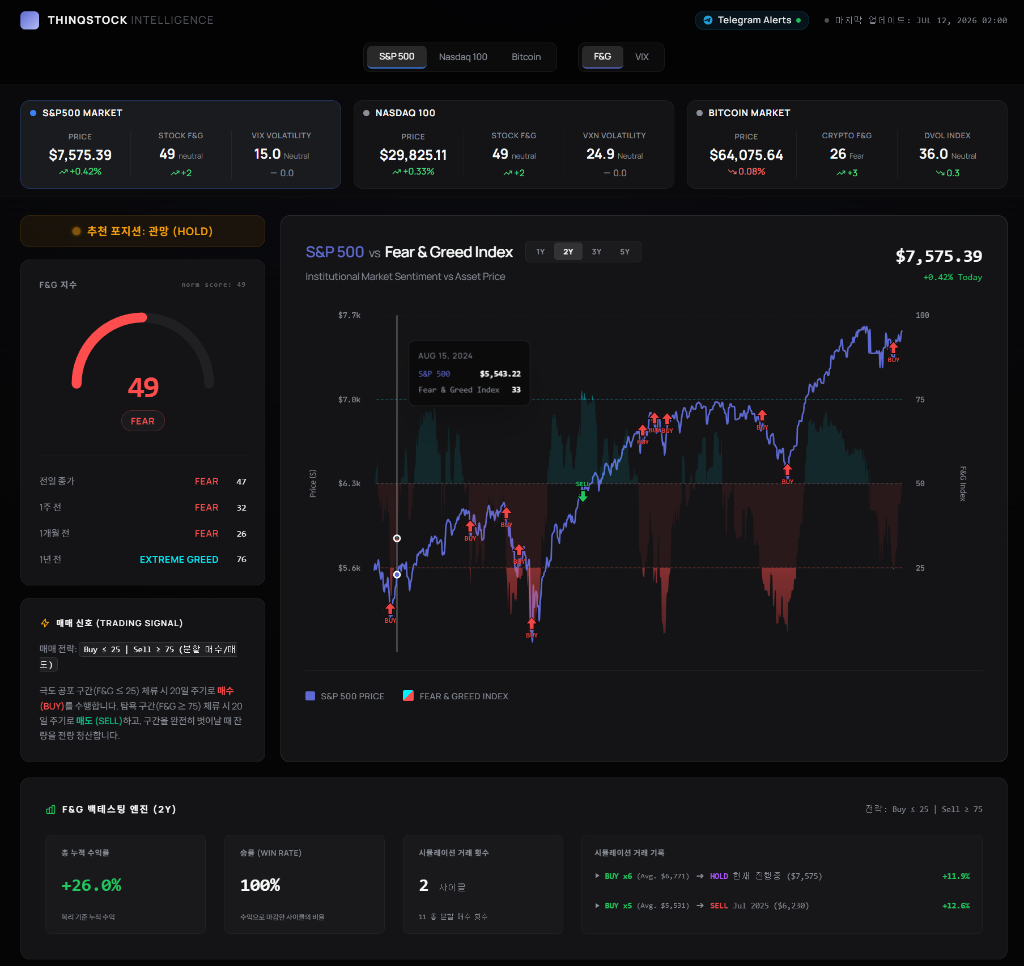
When you build and test strategies in the ThinqStock dashboard, the Maximum Drawdown metric is prominently displayed alongside the total return. We heavily encourage users to optimize for the best risk-adjusted return rather than absolute return.
Here are several ways to systematically limit your MDD using sentiment data:
- Implement Cooldown Periods: As discussed in our risk management series, enforcing a mandatory wait time between entries prevents your algorithm from buying repeatedly during a cascading crash, significantly reducing the depth of the initial drawdown.
- Scale Out During Extreme Greed: Do not just use the Fear & Greed index for buying. A robust system must take profits. Mandating a portfolio reduction when the index crosses into Extreme Greed (above 75) builds a cash buffer that absorbs the impact of the inevitable correction.
- Position Sizing: Never allocate 100% of your portfolio on a single sentiment signal. Use a tranche system. Deploy 25% capital when the index hits 25, another 25% if it hits 15, and reserve the remaining 50% for deep capitulation readings below 10. This averages down your entry price and cushions the portfolio against a prolonged, grinding bear market.
Conclusion
Maximum Drawdown is the ultimate reality check for any trading system. It measures the absolute pain you must endure to achieve your targeted returns. A profound misunderstanding of drawdown math is why so many retail investors fail to compound wealth over multiple economic cycles.
By utilizing the comprehensive, multi-factor sentiment data provided by the ThinqStock index, you can shift your strategy from a passive, vulnerable "Buy & Hold" approach to a dynamic, risk-aware methodology. Your goal is not to predict the future perfectly; your goal is to survive the worst the market can throw at you with your capital and psychology intact. Control the drawdown, and the returns will eventually take care of themselves.