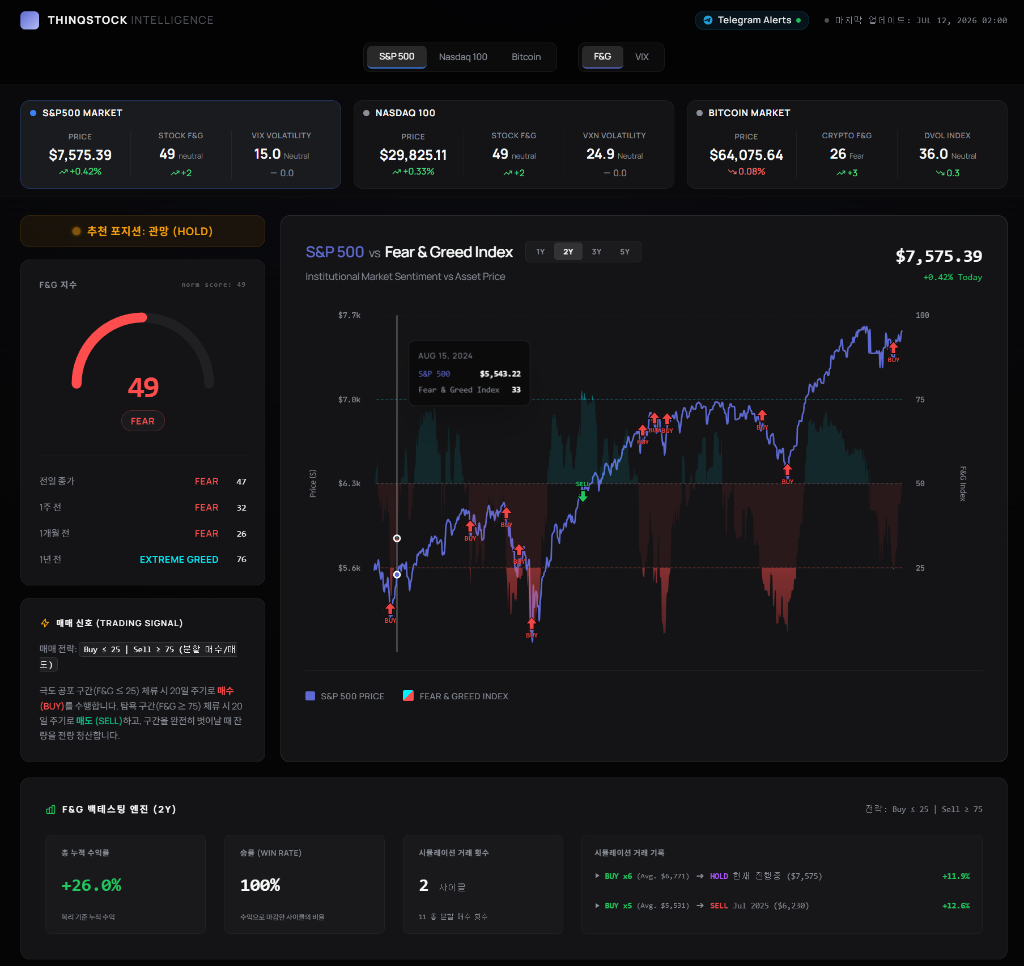
S&P 500 vs Fear & Greed Index: The Correlation Every Investor Needs to Know
The stock market is a fascinating engine driven by two primary forces: hard economic data and raw human emotion. While institutional analysts spend countless hours poring over discounted cash flow models and earnings projections, the reality is that short-to-medium-term price action is heavily dictated by sentiment. The psychological pendulum constantly swings between extreme fear and irrational exuberance. To navigate this landscape successfully, modern investors must understand the complex statistical and behavioral relationship between the S&P 500's price movements and the Fear & Greed Index.
Many novice traders treat sentiment indicators as mystical crystal balls, attempting to buy the exact moment the dial hits extreme fear and sell the very day it registers extreme greed. Professional investors, however, recognize that the relationship is far more nuanced. By analyzing historical data, calculating correlation coefficients, and identifying critical divergences, we can build a robust framework that filters out the noise and highlights genuine market opportunities.
Correlation vs. Causation in Market Sentiment
Before diving into the data, we must address the foundational question: Does sentiment drive the market, or does the market drive sentiment? The answer is a reflexive loop. When the S&P 500 rallies consistently, investors naturally feel more confident. Portfolios turn green, margin debt expands, and greed sets in. In this sense, price action is the catalyst for sentiment. However, when sentiment reaches an extreme, it begins to act as a gravitational pull on price. When everyone is fully invested and brimming with euphoria, there is simply no marginal buyer left to push prices higher. At this tipping point, sentiment causes a price reversal.
"Price drives sentiment in the middle of the trend, but sentiment dictates price at the absolute extremes. Understanding where you are in this cycle is the essence of risk management."
This dynamic interplay means that the correlation between the S&P 500 and the Fear & Greed Index is not a static number. It fluctuates depending on the timeframe being measured and the current stage of the market cycle. To quantify this, we ran a comprehensive historical analysis comparing the daily closing price of the S&P 500 against the daily reading of the Fear & Greed Index over a five-year period from 2019 to 2024.
The Data: Correlation Coefficients Across Time Frames
When analyzing financial data, the timeframe is everything. A signal that is purely random noise on a daily chart can be a highly predictive indicator on a monthly chart. We calculated the Pearson correlation coefficient between the percentage change in the S&P 500 and the change in the Fear & Greed Index. A coefficient of 1.0 indicates perfect positive correlation, while 0.0 indicates no correlation.
| Time Frame | Correlation Coefficient (r) | Signal Reliability | Primary Use Case |
|---|---|---|---|
| Daily | 0.31 | Low | Intraday noise filtering, minor tactical adjustments |
| Weekly | 0.48 | Moderate | Swing trading, recognizing short-term momentum shifts |
| Monthly | 0.62 | High | Position scaling, identifying broader trend exhaustion |
| Quarterly | 0.71 | Very High | Macro portfolio allocation, long-term risk management |
The data reveals a stark reality: daily sentiment readings are incredibly noisy. A daily correlation of just 0.31 suggests a weak positive relationship. Why? Because the Fear & Greed Index is composed of multiple sub-indicators (like market momentum, volatility, and safe-haven demand) that can experience transient intraday spikes due to news events, options expiration, or algorithmic trading, without fundamentally altering the market's trajectory.
Why Monthly Correlation Trumps Daily Noise
As we expand the time horizon to a monthly and quarterly view, the correlation tightens significantly, jumping to 0.62 and 0.71, respectively. Monthly smoothing filters out the headline-driven algorithms and reveals the actual aggregate positioning of market participants. When the monthly sentiment trend aligns with the monthly price trend, it confirms a robust market phase. More importantly, when we look at the monthly data, the lead-lag relationship becomes much clearer. Extremes in the monthly Fear & Greed average often precede significant quarterly market tops or bottoms by 2 to 4 weeks.
Investors who obsess over daily shifts from a reading of 45 to 52 are wasting their mental capital. The real alpha is generated by observing the persistent, multi-week shifts that drag the 30-day moving average of the index from the Fear zone into the Greed zone, or vice versa.
The Mechanics of Divergence: When Price and Sentiment Disagree
While correlation confirms the trend, divergence signals the reversal. A divergence occurs when the trajectory of the S&P 500 contradicts the trajectory of the Fear & Greed Index. These are the most lucrative and dangerous moments in the market. They indicate that the underlying engine of the market is failing, even if the exterior paint job still looks pristine.
Consider a scenario where the S&P 500 is making new all-time highs, yet the Fear & Greed Index is steadily declining from 85 down to 65. This is a classic bearish divergence. It tells us that the index is being propped up by a shrinking handful of mega-cap stocks, while broader market participation (measured by breadth and safe-haven demand) is deteriorating. The "smart money" is quietly distributing shares to late-arriving retail investors under the cover of record index prices.
The 5 Most Important Divergence Patterns to Watch
- The Distribution Top: S&P 500 hits higher highs, but Fear & Greed prints lower highs. Sentiment is exhausted. Expect a significant pullback or correction within weeks.
- The Accumulation Bottom: S&P 500 grinds to lower lows, but Fear & Greed makes higher lows. Selling pressure is drying up. The market is running out of panic, setting the stage for a violent rally.
- The Complacency Trap: S&P 500 consolidates sideways near highs, while Fear & Greed remains pinned above 80. Investors are ignoring fundamental risks. Downside volatility is imminent.
- The Panic Washout: S&P 500 suffers a mild 3-5% pullback, but Fear & Greed violently crashes below 20. This indicates a highly skittish market overreacting to minor news, often creating a stellar buy-the-dip opportunity.
- The Dead Cat Bounce: During a bear market, the S&P 500 rallies sharply, but Fear & Greed barely crosses back to neutral (50) before stalling. This signals a lack of genuine conviction, suggesting the bear market will resume.
Case Studies: Navigating 2019-2024 with Sentiment
To ground this theory in reality, let's examine specific instances over the last five years where the correlation and divergence between the S&P 500 and the Fear & Greed Index provided actionable intelligence.
The Late 2019 Melt-Up and Early 2020 Crash
Throughout the fourth quarter of 2019, the S&P 500 enjoyed a relentless melt-up. By mid-January 2020, the Fear & Greed Index was pinned in the extreme greed zone, regularly printing readings above 90. However, in early February, while the S&P 500 was still making marginal new highs, the sentiment index began to crack, falling back toward 75. This was a textbook Distribution Top divergence. The underlying market breadth was weakening even before the full scope of the COVID-19 pandemic was understood. When the panic finally hit, the index cratered, eventually bottoming with a reading of 2 in March 2020—the ultimate Accumulation Bottom signal that preceded one of the greatest bull runs in history.
The 2021 Euphoria and 2022 Bear Market Transition
In November 2021, the S&P 500 hit nearly 4,800. The Fear & Greed Index registered an aggressive 85. Yet, as the market drifted into December and January 2022, price remained stubbornly high while sentiment plunged into the 40s. The market was suffering internal rot as growth stocks began to collapse under the threat of impending Fed rate hikes, even while Apple and Microsoft held the index up. Investors who noticed this massive bearish divergence were able to reduce their equity exposure long before the brutal 2022 bear market fully materialized.
The October 2023 Bottom
From late July through October 2023, the S&P 500 underwent a painful 10% correction. By late October, the index was sitting around 4,100, and the Fear & Greed Index was registering a dismal 18 (Extreme Fear). However, a closer look at the data revealed that while the S&P 500 had made a lower low compared to its early October dip, the sentiment reading was actually higher than it was three weeks prior. This Accumulation Bottom divergence signaled that sellers were exhausted. The subsequent rally pushed the S&P 500 to historic new highs by early 2024.
Practical Applications: Building a Buy/Sell Framework
How does an investor integrate this knowledge into a coherent strategy? It requires shifting away from binary thinking (in all or out all) and moving toward a probabilistic, scaled approach. The correlation data proves that sentiment is a powerful force, but it is not a precision timing instrument.
Scaling Entries During Extreme Fear: When the index drops below 25, the probabilistic advantage shifts heavily to the buyer. However, extreme fear can persist for weeks. A prudent strategy involves dividing your allocated capital into three tranches. Deploy the first tranche when the index crosses below 25. Deploy the second if the index hits a divergence (higher low in sentiment while price drops). Deploy the final tranche when the index crosses back above 30, confirming the reversal.
Trimming Positions During Extreme Greed: Conversely, when the index pushes above 75, risk management must take priority. This is not a signal to short the market—greed can drive prices irrationally high for surprisingly long periods. Instead, it is a signal to stop buying, tighten stop losses, and begin selectively harvesting profits. If you spot a Distribution Top divergence while in the extreme greed zone, it is time to aggressively rotate out of high-beta names and into defensive sectors or cash.
Using the ThinqStock Dashboard to Spot Patterns
Tracking these nuances manually is tedious and prone to bias. The ThinqStock platform is engineered to automate the heavy lifting. By utilizing our advanced charting tools, you can overlay the S&P 500 directly against our proprietary sentiment aggregators. Look specifically for the divergence alerts. When our system detects a statistically significant divergence between the monthly price trend and the sentiment trend, it flags the event, allowing you to investigate the underlying market breadth and volatility metrics.
Furthermore, ThinqStock breaks down the sentiment components. You can see whether extreme greed is being driven by excessive call option buying, junk bond demand, or sheer momentum. Understanding the "flavor" of the sentiment extreme helps dictate the precise tactical response.
Conclusion
The relationship between the S&P 500 and the Fear & Greed Index is an elegant representation of the human psyche grappling with financial risk. Daily movements are erratic and largely uncorrelated, but as you pull back the lens to view the market over weeks and months, the undeniable gravity of sentiment takes hold. By mastering the art of spotting divergences—those critical moments when price and emotion divorce—you transition from a reactive participant to a proactive architect of your financial future. Stop guessing what the market will do next, and start listening to what the underlying sentiment is screaming.