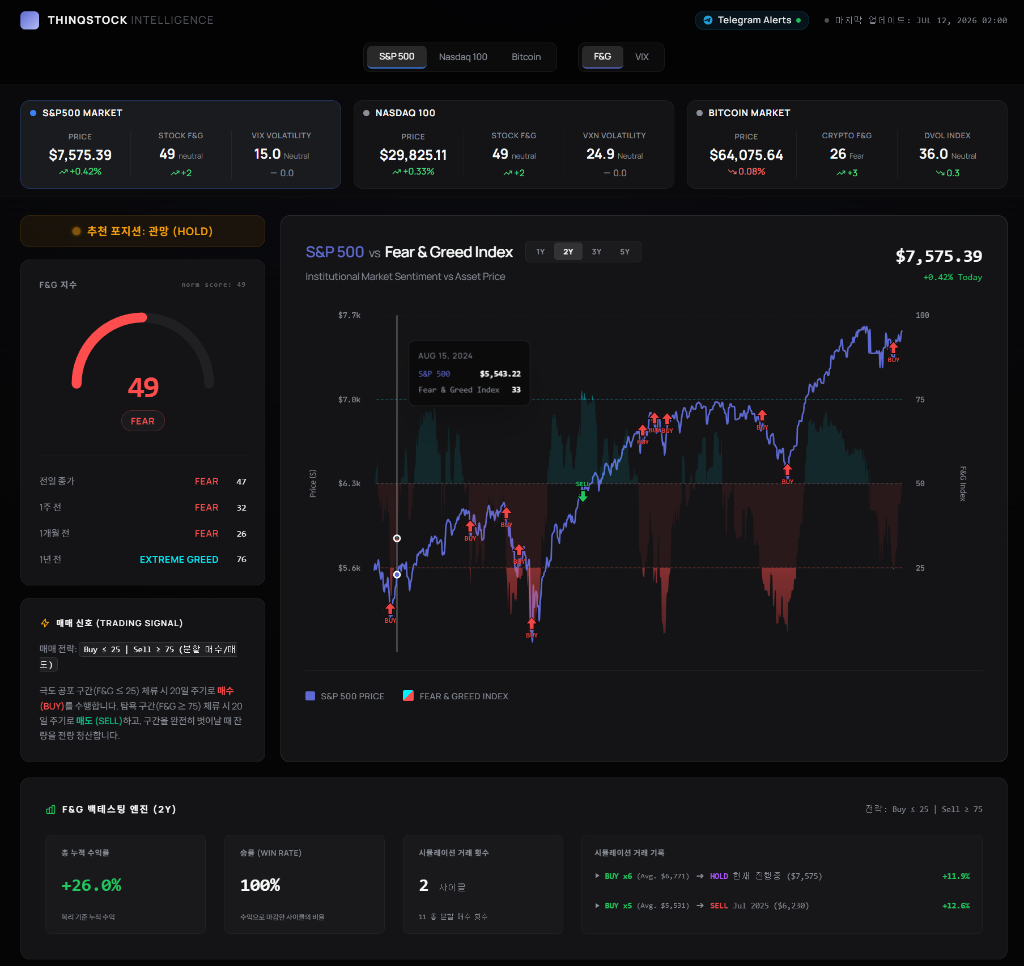
Stock Price Breadth: The Hidden Sentiment Signal Inside the Fear & Greed Index
When financial media reports on the stock market, they almost exclusively focus on the headline index number—usually the S&P 500 or the Dow Jones Industrial Average. "The market was up 1% today," they declare. However, professional traders know that these headline indices are market-cap weighted. This means a handful of massive, trillion-dollar companies can completely distort the reality of what the average stock is actually doing.
To see the true, unvarnished health of the market and the underlying psychology of the investing public, we must look beneath the surface. We must measure market breadth. Within the robust architecture of the Fear & Greed Index, stock price breadth acts as an essential truth-teller. In this guide, we will explore exactly what market breadth measures, why the McClellan Volume Summation Index is the gold standard for tracking it, and how to spot hidden divergences that signal major market turning points.
What Market Breadth Measures
Market breadth is a mathematical evaluation of the overall participation in a market move. Rather than calculating the price change of a weighted index, breadth looks at the sheer number of individual stocks advancing versus the number of stocks declining, and the volume of shares traded in each category.
Imagine an army marching forward. The "index level" is the general at the front. The "breadth" is the troops behind him. If the general is charging forward, but 80% of the troops are retreating, that army is fundamentally weak, and the advance will soon collapse. Conversely, if the general is temporarily retreating, but 90% of the troops are resolutely holding the line or moving forward, the overall army is incredibly strong.
In stock market terms, true, sustainable bull markets are characterized by widespread participation across all sectors—small-caps, mid-caps, and large-caps alike. When breadth is strong, greed is healthy and distributed. When breadth is weak, it indicates underlying fear and institutional distribution (selling) happening under the cover of a rising index.
The Divergence Warning: Index Up, Breadth Down
The most powerful signal that market breadth provides is a negative divergence. This occurs during the late stages of a bull market. The headline index (like the S&P 500) will continue to push to new all-time highs, driven entirely by a small handful of mega-cap technology stocks. Retail investors, seeing the index rise, feel euphoric and greedy.
However, the breadth data will show that underneath the surface, more and more individual stocks are quietly rolling over into downtrends. The advance/decline line begins to slope downward. This divergence is the ultimate warning sign. It tells quantitative analysts that the market is hollowing out from the inside. The "troops" are retreating, leaving the mega-cap "generals" completely exposed. Inevitably, the generals eventually fall, triggering a violent and sudden market correction.
“A rising market with deteriorating breadth is a classic bull trap. The index level projects confidence, but the internal breadth reveals that institutional liquidity is being systematically withdrawn.”
The McClellan Summation Index Explained
While there are many ways to measure breadth, the Fear & Greed Index relies heavily on a highly sophisticated metric: the McClellan Volume Summation Index. Developed by Sherman and Marian McClellan, this indicator is derived from the McClellan Oscillator, which tracks the difference between the number of advancing and declining issues on the New York Stock Exchange (NYSE), smoothed by two exponential moving averages (typically 19-day and 39-day).
The Summation Index takes a running cumulative total of the daily oscillator values. Because it is cumulative, it acts as a massive, slow-moving gauge of long-term liquidity and trend health. It filters out the daily noise and reveals the massive structural tides of capital flowing into or out of the broader market.
Understanding the Breadth Readings
Interpreting the McClellan Summation Index involves looking at absolute levels as well as the direction of the trend. The table below outlines how these readings translate directly into market sentiment and actionable signals.
| Summation Index Reading | Market Breadth State | Sentiment Interpretation |
|---|---|---|
| +500 to +1000 | Strong Positive Breadth | Greed - Robust, broad-based bull market. High participation. |
| +100 to +500 | Positive Breadth | Constructive - Normal healthy uptrend environment. |
| -100 to +100 | Neutral Breadth | Choppy / Indecisive - Market lacks clear directional liquidity. |
| -100 to -500 | Negative Breadth | Fear - Deteriorating internals, sellers taking control. |
| -500 to -1000 | Strong Negative Breadth | Extreme Fear - Broad-based liquidation event. |
| Below -1000 | Extreme Negative (Capitulation) | Panic - Maximum historical oversold levels. Bounce imminent. |
When the Summation Index drops below -1000, it indicates that virtually every stock on the exchange is being mercilessly sold. It is a state of pure, unadulterated panic. Statistically, markets cannot sustain this level of one-sided pressure for long. Readings below -1000 are historically correlated with generational market bottoms.
How Breadth Feeds Into the Fear & Greed Index Calculation
In the ThinqStock ecosystem, the Fear & Greed Index is not a monolithic number; it is a composite. Stock Price Breadth (via the McClellan Summation Index) serves as the "Trend Confirmation" pillar of the model.
If options traders are buying puts (high Put/Call ratio), but the Summation Index remains positive and healthy (+300), the Fear & Greed Index will not trigger an Extreme Fear signal. The model recognizes that the options panic is likely just short-term hedging because the structural breadth of the market remains sound.
Conversely, if both the Put/Call Ratio hits extreme levels and the Summation Index plummets to -800, the composite index triggers a profound buy signal. The combination of options panic and structural breadth capitulation provides the high-probability setup that algorithmic traders seek.
Using Breadth to Confirm Signals
The most actionable way to use breadth is for confirmation of trend changes. When the Summation Index is deeply negative (e.g., -900) but stops falling and begins to hook upward, it signals that the intense selling pressure has exhausted itself. Even if the S&P 500 continues to drift slightly lower for a few days, the internal improvement in breadth confirms that a major bottoming process is underway. This upward hook in breadth is often the precise moment sophisticated capital begins aggressively buying equities.
Conclusion
Ignoring market breadth is akin to driving a car by only looking at the speedometer while completely ignoring the engine temperature gauge. The headline index tells you how fast the market is moving, but the McClellan Summation Index tells you if the engine is about to overheat and stall.
By understanding and tracking Stock Price Breadth as a core component of sentiment analysis, you immunize yourself against deceptive late-stage bull traps. You gain the ability to look beneath the surface of the S&P 500 and base your capital allocation decisions on the true flow of institutional liquidity. When the generals finally retreat, you will already be positioned safely, and when the troops are exhausted and panic-stricken, you will be armed with the data necessary to buy the bottom.