VIX vs DVOL: Comparing Stock and Crypto Volatility Gauges
If you've spent any time around financial markets, you've heard about the VIX — the so-called "fear gauge" of Wall Street. What's less well known is that the crypto world has its own equivalent: DVOL, Deribit's Bitcoin Implied Volatility Index. Both measure the same fundamental thing — how much fear or uncertainty is priced into options markets — yet they behave in dramatically different ways, live in completely different numerical ranges, and sometimes tell completely different stories about risk.
Understanding both is becoming increasingly important. As institutional money flows between equities and digital assets, and as macro events ripple across every asset class simultaneously, being fluent in both volatility gauges gives you an analytical edge that most retail investors simply don't have. This guide breaks it all down — how each index is built, why Bitcoin's volatility baseline is structurally higher, and what it means when the two diverge.
How the VIX Is Calculated
The CBOE Volatility Index (VIX) was introduced in 1993 and remains the gold standard for equity market fear measurement. Despite its reputation as a simple "fear number," the actual calculation is more nuanced than most people realize.
The VIX measures the market's expectation of 30-day volatility on the S&P 500 index, derived from the prices of SPX options. Crucially, it doesn't just look at at-the-money options — it takes a weighted average of all out-of-the-money put and call options across a wide range of strike prices. This breadth is what makes it robust: the VIX isn't capturing just one bet on the market's direction, it's aggregating the collective hedging and speculative activity across the entire options chain.
The formula uses two sets of options — one expiring just before the 30-day target and one just after — and interpolates between them to produce a constant 30-day forward-looking number. The result is expressed as an annualized percentage. A VIX reading of 20 means the market is pricing in roughly 20% annualized volatility, which translates to approximately ±1.15% daily moves (20 divided by the square root of 252).
What VIX Numbers Actually Mean in Practice
Over its three-decade history, the VIX has established relatively consistent behavioral ranges. Readings below 15 tend to coincide with slow, grinding bull markets where there's little institutional demand for downside protection. Readings above 30 typically signal genuine market stress. The highest close ever recorded was 82.69 on March 16, 2020 — the moment COVID-19 uncertainty peaked and liquidity evaporated from options markets simultaneously.
How DVOL Is Calculated
Deribit, the dominant Bitcoin and Ethereum options exchange, launched its DVOL index in 2021. The methodology deliberately mirrors the VIX construction — it aggregates implied volatility across all BTC options contracts targeting a constant 30-day expiry window, using out-of-the-money puts and calls across multiple strikes.
The key difference isn't the math — it's the underlying asset. Bitcoin trades 24 hours a day, 7 days a week, with no circuit breakers, no market-maker obligations, and a far smaller market cap than the S&P 500. These structural features mean that the baseline level of implied volatility is permanently higher. When VIX sits calmly at 15, DVOL might be at 50 — and that's considered an equally calm environment for Bitcoin.
DVOL also benefits from Deribit's dominant position in crypto options. Roughly 85-90% of all Bitcoin and Ethereum options volume globally flows through Deribit, which means DVOL is capturing a genuine, deep, liquid signal rather than a thin, easily manipulated one.
Volatility Regime Comparison Table
The single most disorienting thing for equity traders who look at DVOL for the first time is the numbers. A DVOL of 60 looks alarming — until you realize it's the rough equivalent of a VIX at 15. The table below maps the corresponding sentiment regimes:
| Market Regime | VIX Range | DVOL Range | Signal Interpretation |
|---|---|---|---|
| Normal / Calm | 10 – 20 | 40 – 55 | Low fear, risk-on appetite, markets grinding higher |
| Elevated Concern | 20 – 30 | 55 – 75 | Uncertainty rising, hedging activity increasing |
| Panic Zone | 30 – 50 | 75 – 90 | Active fear, forced selling, credit stress emerging |
| Capitulation | 50+ | 90+ | Maximum fear, potential exhaustion and reversal zone |
Why Bitcoin's Volatility Baseline Is Structurally Higher
This isn't a temporary phase Bitcoin will "grow out of" as it matures. The elevated baseline reflects several permanent structural features of the asset:
- No closing bell: Bitcoin absorbs global macro shocks in real time, 24/7. When a Fed statement drops at 2pm EST, equity markets may only absorb the shock for two hours before closing. Bitcoin keeps trading all night, amplifying volatility.
- Leverage saturation: The crypto derivatives ecosystem is saturated with highly leveraged positions — 10x, 25x, even 100x leverage is commonplace. When prices move against leveraged longs or shorts, liquidation cascades create violent, self-reinforcing moves that have no parallel in equity markets.
- Smaller market cap means larger impact per dollar: The entire Bitcoin network had a market cap of roughly $500 billion as of early 2024. The S&P 500 represents $45+ trillion in market value. A $5 billion sell order has an utterly different impact on each.
- Regulatory uncertainty: Policy risk in crypto remains unresolved across most major jurisdictions, adding a persistent uncertainty premium that options traders have to price in continuously.
"The VIX hitting 30 is a five-alarm fire in equity markets. DVOL hitting 75 is a Tuesday in a bear market. Context — not the raw number — is everything when comparing these two indexes."
Historical Parallel Spikes: When Both Indexes Surged Together
Some of the most instructive data points come from events that caused simultaneous spikes in both indexes. These moments confirm that the two measures are connected to the same underlying macro psychology, even if they operate in different numerical universes:
| Event | VIX Peak | DVOL Peak | Key Driver |
|---|---|---|---|
| March 2020 (COVID crash) | 82.69 | ~160 | Global liquidity crisis, everything-sold panic |
| June 2022 (Fed pivot panic) | 34.02 | ~95 | Aggressive rate hike fears, crypto contagion (LUNA collapse) |
| November 2022 (FTX collapse) | 25.11 | ~82 | Crypto-specific contagion; VIX elevated but muted vs DVOL |
| August 2024 (Yen carry unwind) | 38.57 | ~74 | Japanese yen shock, cross-asset deleveraging |
The March 2020 reading is the most extreme on record for both indexes. What's notable is the ratio: DVOL at 160 vs VIX at 82 represents roughly a 2x multiplier, consistent with Bitcoin's structurally higher baseline. The FTX collapse in November 2022 is an interesting counterexample — DVOL spiked hard because it was a direct crypto event, but VIX only reached 25, showing that the stress was largely contained within the crypto ecosystem rather than bleeding into broad equities.
Correlation Between VIX and DVOL: Closer Than You'd Think
Despite operating in different asset classes and different numerical ranges, VIX and DVOL exhibit surprisingly high correlation during macro stress events. Research from Deribit and various quantitative funds suggests a rolling 30-day correlation coefficient that typically ranges between 0.55 and 0.75 during normal periods, spiking toward 0.85-0.90 during major risk-off events when correlations across all assets tend to converge toward 1.
This makes intuitive sense. The same institutional players — large hedge funds, proprietary trading desks, family offices — are active in both markets. When they need to raise cash or reduce gross exposure, they sell across all liquid markets simultaneously, creating synchronized volatility spikes. Bitcoin, once considered a "non-correlated asset," has increasingly behaved as a high-beta risk asset during macro stress periods.
When They Diverge: The Most Important Signal
Divergence between VIX and DVOL is where the real analytical value lies. There are two primary divergence patterns to watch:
Pattern 1: DVOL spikes but VIX stays calm. This typically indicates a crypto-specific event — an exchange collapse, a major protocol exploit, a regulatory crackdown. The FTX collapse in November 2022 is the textbook example: DVOL went from 65 to 82 in days while VIX barely moved above 25. For equity-focused investors, this is often a non-event. For crypto investors, it's a critical warning signal.
Pattern 2: VIX spikes but DVOL lags behind. This scenario is rarer and more nuanced. It can happen when a macro event initially hits traditional markets harder — a banking shock, a geopolitical event, or a sudden equity selloff — while crypto markets haven't yet repriced the risk. Historically, when VIX leads DVOL higher, Bitcoin tends to catch up within 24-72 hours as the macro stress bleeds into digital assets. This pattern can serve as an early warning for crypto traders watching equity fear gauges.
The Divergence Trading Framework
When DVOL is elevated relative to its historical percentile while VIX remains below its equivalent percentile — or vice versa — it signals that one market is pricing in significantly more risk than the other. These divergences tend to resolve by the lower-fear market catching up to the higher-fear market, not by the panicking market calming down. Position sizing and hedging accordingly can improve risk-adjusted returns significantly.
Which Indicator Leads the Other During Macro Stress?
This is one of the most debated questions among cross-asset traders. The evidence is mixed, but some patterns emerge from studying historical data:
During equity-driven macro events — Fed policy shocks, banking crises, recession fears — the VIX tends to lead. Institutional equity investors are generally faster to hedge through SPX options than crypto traders are to hedge through BTC options, so the VIX often reflects stress first. Crypto then follows as the risk-off sentiment spreads.
During crypto-native events such as exchange collapses, regulatory actions, and protocol failures, DVOL leads decisively and often VIX never catches up at all, confirming the stress is asset-class-specific.
During liquidity crises — the rarest and most dangerous category — both indexes spike simultaneously and nearly instantaneously, because the mechanism (forced selling to raise cash) hits all liquid markets at the same moment. March 2020 demonstrated this clearly and brutally.
Practical Trading Rules Using Both Gauges
Knowing the history is useful. Having an actionable framework is better. Here's how sophisticated cross-asset traders use both VIX and DVOL together:
For Equity Traders
- Monitor DVOL as an early warning system. A DVOL spike into the 80-90 range without a corresponding VIX move above 25 often indicates crypto-specific stress and potential contagion risk worth watching closely.
- When both VIX and DVOL are simultaneously in their respective "panic zone" ranges, the probability of a near-term market bottom in both assets historically increases significantly.
- A VIX above 35 combined with DVOL above 85 has preceded strong 60-90 day equity returns in 4 out of the 5 cases observed since 2018.
For Crypto Traders
- A rising VIX is a leading indicator for Bitcoin downside. When the VIX moves from 15 to 25+ in a short period, Bitcoin has historically followed with 15-30% drawdowns within weeks.
- DVOL readings above 90 have historically been associated with Bitcoin prices near cyclical bottoms, particularly when sustained for more than 5 consecutive trading days.
- Calm DVOL (below 50) during a period of elevated VIX (above 20) suggests Bitcoin may be temporarily decoupling from macro — often unsustainable, and usually resolved with Bitcoin selling off to re-correlate.
Using VIX and DVOL on ThinqStock
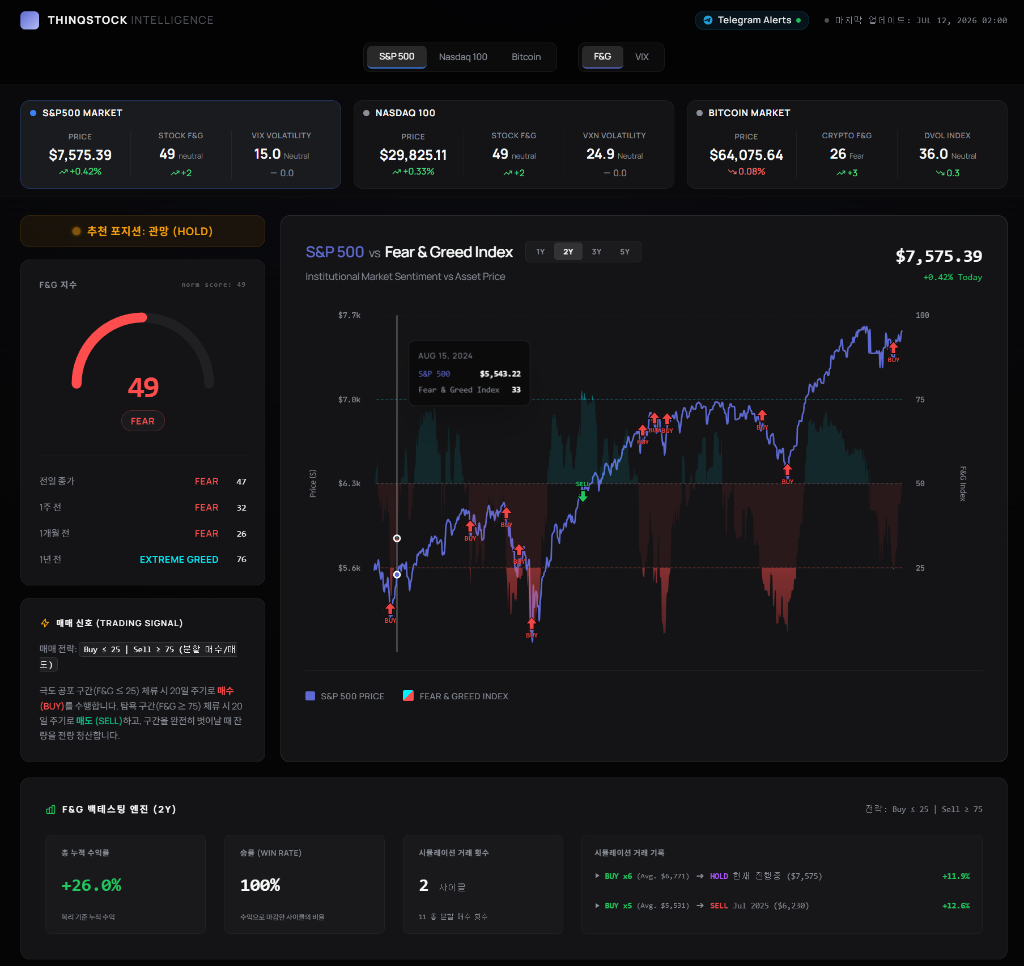
The ThinqStock dashboard integrates volatility data as one of the core components feeding into the overall sentiment reading for both equities and crypto. The platform normalizes each index against its own historical percentile range — so rather than showing you a raw DVOL of 58 (which means nothing without context), it shows you where that reading sits relative to the past 52 weeks.
This percentile normalization is the key to making the two indexes genuinely comparable side-by-side. When ThinqStock shows "Volatility: Fear" for both the S&P 500 and Bitcoin simultaneously, it means both markets are in their respective upper-fear zones relative to their own historical baselines — a rare alignment that has historically been followed by above-average forward returns in both asset classes.
Check the full factors breakdown to see the current volatility readings alongside the other components driving today's Fear & Greed score.
"Two fear gauges. Two asset classes. One macro story. When VIX and DVOL both scream panic at the same moment, that's the market creating opportunity — if you have the conviction and the cash to act on it."
The Bottom Line
VIX and DVOL are fundamentally the same tool applied to fundamentally different markets. Understanding the structural reasons for Bitcoin's higher volatility baseline — leverage saturation, 24/7 trading, smaller market cap, regulatory uncertainty — prevents the common mistake of misinterpreting a DVOL of 60 as a crisis signal when it's actually a calm reading for crypto.
The real analytical power emerges when you use them together. Alignment confirms macro fear is systemic. Divergence reveals which market is mispricing risk. And extreme simultaneous spikes in both historically mark some of the best risk/reward entry points across all asset classes — if you can stomach the short-term pain and think in multi-month timeframes.
Whether you're managing an equity portfolio, a crypto portfolio, or both, keeping both gauges on your dashboard isn't optional anymore. It's table stakes for cross-asset awareness in modern markets.