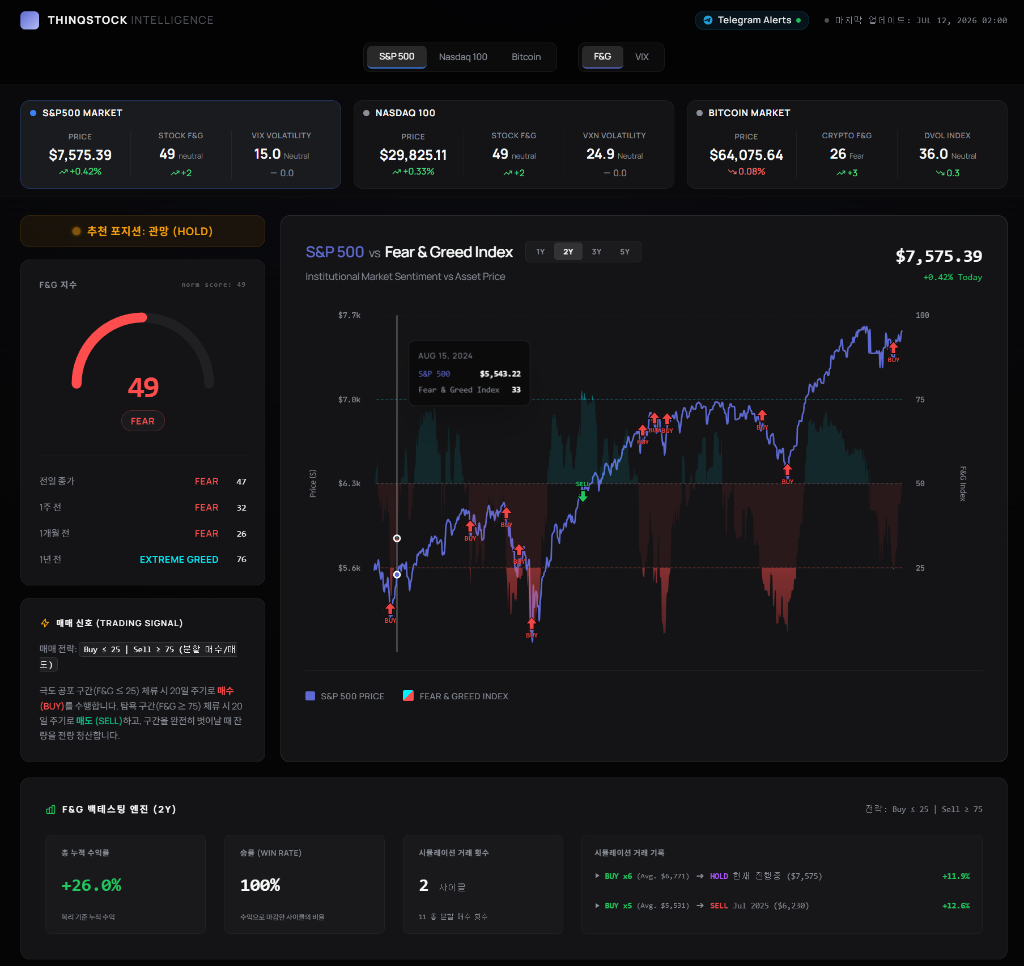
What Happens When the Fear and Greed Index Drops Below 20?
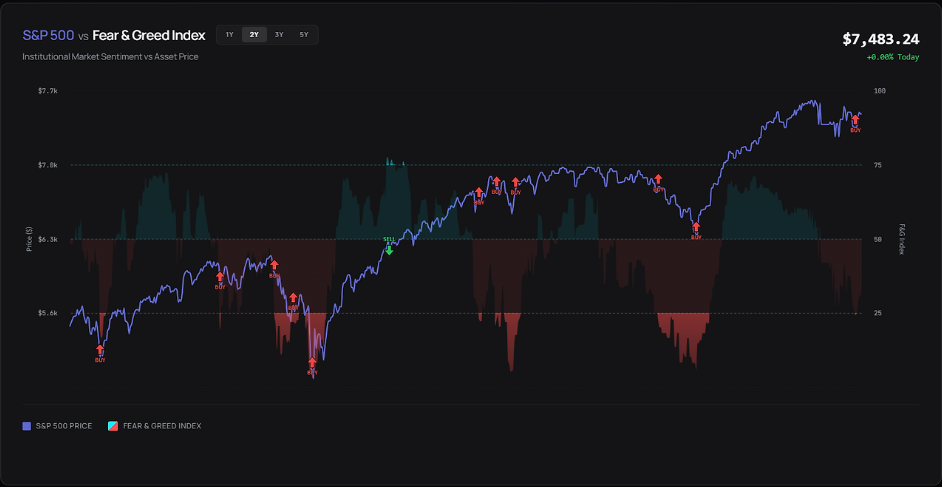
Historically, when the Fear and Greed Index drops below 20, it marks one of the most profitable buy signals for the S&P 500. While buying during extreme fear is psychologically difficult, the data shows that entering the market at these levels has historically generated outsized returns. There's a quote most investors have heard a hundred times: "Be greedy when others are fearful." Warren Buffett said it. Howard Marks has written entire memos about it. And yet when the Fear & Greed Index actually crashes below 20 — when the screen is screaming Extreme Fear — almost no one buys. The headlines are catastrophic, your portfolio is bleeding, and the instinct to wait for clarity feels overwhelming.
That instinct, statistically speaking, costs investors a tremendous amount of money. This piece digs into exactly what happens to the S&P 500 in the 3, 6, and 12 months after the Fear & Greed Index drops into single or low-double-digit territory — and why those moments, as uncomfortable as they are, have historically represented some of the best entry points of a generation.
What Does a Fear & Greed Score Below 20 Actually Mean?
The CNN Fear & Greed Index aggregates seven distinct market indicators: market momentum (S&P 500 vs. its 125-day moving average), stock price strength (52-week highs vs. lows on NYSE), stock price breadth (advancing vs. declining volume), put/call options ratio, market volatility (VIX), junk bond demand (spread between investment-grade and junk bonds), and safe-haven demand (stocks vs. bonds performance).
Each component is scored on a 0–100 scale. When the composite average drops below 20, it signals that virtually every single one of these dimensions is flashing distress simultaneously. It's not one bad day in the options market or a brief VIX spike — it's a coordinated, multi-dimensional panic across the entire financial system.
Readings below 20 are genuinely rare. In any given year, the Fear & Greed Index might dip into Fear territory (20–40) dozens of times. But sub-20 readings typically cluster around identifiable macro shocks: credit crises, pandemic-level dislocations, central bank policy pivots, or geopolitical black swans. Since 2008, there have been only six major episodes where the index sustained readings below 20 for more than a week.
"The time to buy is when there's blood in the streets, even if the blood is your own." — Baron Rothschild, 18th century financier. Few principles in investing have proven more durable across centuries of market history.
The Psychological Mechanism Behind Extreme Fear
Understanding why these moments create opportunity requires understanding what drives the Fear & Greed Index to such extremes in the first place. When institutions are forced to sell — margin calls, redemption pressure, regulatory capital requirements — they sell what they can, not what they want to. This creates indiscriminate selling that disconnects price from fundamental value.
Simultaneously, retail investors capitulate. Search trends for "sell stocks" and "market crash" peak. Money flows into money market funds at record rates. Options traders pay extreme premiums for downside protection. All of this is measurable, and all of it feeds into a sub-20 Fear & Greed reading. The key insight is that this behavior marks exhaustion — not the beginning of a permanent decline, but the end of the panic selling phase.
Historical Instances: Six Episodes That Defined Contrarian Investing
The following table documents the six major episodes since 2008 when the Fear & Greed Index sustained readings below 20. For each event, we've recorded the approximate trough score, the S&P 500 level at that reading, and the subsequent returns over the following 3, 6, and 12 months.
| Period / Event | F&G Score | S&P 500 Level | +3 Month Return | +6 Month Return | +12 Month Return |
|---|---|---|---|---|---|
| Nov 2008 – Financial Crisis | 6 | ~820 | +14.8% | +35.2% | +53.6% |
| Aug 2011 – US Debt Downgrade | 10 | ~1,120 | +17.3% | +14.9% | +24.1% |
| Aug 2015 – China Devaluation | 14 | ~1,867 | +11.4% | +5.6% | +13.8% |
| Dec 2018 – Fed Rate Hike Panic | 8 | ~2,351 | +21.6% | +17.8% | +31.5% |
| Mar 2020 – COVID Crash | 3 | ~2,386 | +39.9% | +43.5% | +74.8% |
| Oct 2022 – Rate Hike Bear Market | 11 | ~3,577 | +16.3% | +12.8% | +22.4% |
The numbers tell a striking story. Across all six episodes, the average 12-month forward return from a sub-20 Fear & Greed reading was +36.7%. Even the weakest performer — the August 2015 China devaluation shock — delivered a respectable +13.8% over the following year. The best performer, March 2020, delivered returns that genuinely changed the financial trajectories of investors who had the conviction to buy.
Breaking Down Each Episode
November 2008: The Financial Crisis Floor
The 2008 financial crisis was unlike anything seen since the Great Depression. Lehman Brothers had just failed, AIG was being nationalized, and the entire global banking system was in question. The Fear & Greed Index hit a trough of 6 — nearly unmeasurably low. The S&P 500 was around 820. Most market commentators were debating whether the Dow could fall to 5,000 or lower. Anyone buying in November 2008 looked reckless by conventional wisdom standards. By November 2009, the market was up 53.6% from those lows.
August 2011: The US Debt Downgrade
Standard & Poor's stripped the United States of its AAA credit rating for the first time in history on August 5, 2011. The move sent shockwaves through global markets. The Fear & Greed Index dropped to 10. The S&P 500 fell more than 16% in just three weeks. But within three months of the Fear & Greed trough, markets had recovered nearly all losses — and by August 2012 were up over 24%.
August 2015: China's Currency Devaluation
This episode is the most nuanced of the six. China's surprise yuan devaluation triggered a flash crash moment in US equities — the S&P 500 fell 11% in a week. The Fear & Greed Index hit 14. Unlike the other crises, the 6-month return was modest at +5.6%, reflecting that the macro uncertainty took longer to resolve. But the 12-month return of +13.8% still meaningfully outperformed the long-run average.
December 2018: The Fed's Policy Error Panic
December 2018 saw the worst December for US stocks since 1931. The Federal Reserve raised rates in mid-December despite slowing economic data, and markets cratered. The S&P 500 fell nearly 20% from its September 2018 peak, and the Fear & Greed Index dropped to 8. Fed Chair Powell then pivoted sharply in January 2019, signaling a pause in rate hikes. The three-month return from the December 2018 trough was +21.6%.
March 2020: COVID — The Fastest Crash in History
The S&P 500 fell 34% in 33 calendar days — the fastest bear market in history. On March 23, 2020, the Fear & Greed Index printed a 3 — a reading so low it had never been seen before in the modern history of the index. The Federal Reserve launched unlimited QE, Congress passed the CARES Act, and markets bottomed almost to the day. From those March 2020 lows, the S&P 500 gained nearly 75% over the next twelve months.
October 2022: The Rate Hike Bear Market
The most recent episode came at the tail end of the most aggressive Fed tightening cycle since the 1980s. With 10-year Treasury yields approaching 4.25%, the S&P 500 fell 25% from its January 2022 peak. The Fear & Greed Index hit 11 in early October 2022 — which, in retrospect, marked the precise bottom of that bear market. Markets gained 16.3% over the following three months.
The Cooldown Period: Why You Don't Catch the Exact Bottom
One critical nuance the data table doesn't capture: buying the moment the Fear & Greed Index first hits 20 doesn't guarantee you buy the bottom. In many of these episodes, the index remained in extreme fear territory for weeks or even months. The 2008 financial crisis kept the index below 20 from October through December 2008. The 2022 bear market had multiple sub-20 readings between June and October 2022.
The Staged Entry Framework
Rather than trying to time the exact bottom, experienced contrarian investors often use a staged entry approach during extreme fear periods:
- Stage 1 (F&G: 15–20): Deploy 25–30% of available cash. Acknowledge the risk is high, but the asymmetry is favorable.
- Stage 2 (F&G: 10–15): Deploy another 25–30%. Panic is deepening but exhaustion is likely near.
- Stage 3 (F&G: below 10): Deploy the remaining capital. These readings are historically rare and represent maximum opportunity.
- Post-recovery (F&G: 30–40): Re-evaluate positions as sentiment normalizes. This is not the time to add aggressively.
This staged approach solves the psychological problem of buying into a falling market. By pre-committing to a rules-based framework, you remove the temptation to wait for "more certainty" — which, in markets, typically arrives after prices have already recovered significantly.
How to Use the ThinqStock Dashboard to Spot These Moments
Real-time monitoring of the Fear & Greed Index is where the ThinqStock dashboard becomes genuinely useful. Rather than checking the index manually each day, you can watch multiple sentiment dimensions simultaneously and see them converge in real time.
Key Dashboard Signals to Watch
When the ThinqStock composite Fear & Greed reading approaches 20, several component signals typically converge:
- VIX spike: The CBOE Volatility Index typically surpasses 30, often 40+, during sub-20 Fear & Greed readings. This reflects the options market pricing in extreme near-term risk.
- Put/Call ratio surge: When investors are paying massive premiums for downside protection, the put/call ratio spikes above 1.2. This is a classic capitulation signal.
- 52-week lows dominating: During extreme fear, the number of NYSE stocks hitting 52-week lows dramatically outpaces new highs — often by ratios of 10:1 or more.
- Junk bond spread widening: Credit markets often "see" the crisis before equity markets fully price it in. When investment-grade vs. high-yield spreads blow out, it feeds directly into the Fear & Greed calculation.
- Safe-haven flows: Treasury yields fall sharply as capital floods into government bonds, pushing the stock/bond return spread to extreme levels.
Tracking all seven of these components manually is time-consuming. The ThinqStock platform aggregates these signals into a single, real-time view, making it far easier to identify when multiple factors are converging into an extreme fear reading.
Risk Management: What Can Go Wrong
It would be irresponsible to present this data without acknowledging the risks. The historical record is compelling, but no strategy works 100% of the time. There are three scenarios where buying at sub-20 Fear & Greed readings produces poor outcomes:
Scenario 1: The Structural Bear Market
The 2000–2002 dot-com bust and parts of the 2008 financial crisis saw the Fear & Greed Index drop to extreme lows multiple times before the market bottomed. If you bought the first sub-20 reading in early 2001, you watched the market continue falling for another 18 months. Sub-20 readings are necessary but not sufficient to confirm a bottom — they indicate extreme fear, not necessarily the final low.
Scenario 2: The Macro Regime Shift
When interest rates rise dramatically over a short period (as in 2022), equity valuations face structural headwinds beyond what sentiment alone can resolve. The 2022 case ultimately worked out, but investors who bought the first sub-20 reading in June 2022 endured another 15% drawdown before October's final bottom.
Scenario 3: Liquidity Constraints
If you're forced to sell at any point during the recovery period — due to margin calls, personal financial needs, or psychological tolerance limits — the strategy fails regardless of the ultimate market outcome. Position sizing and genuine long-term capital are prerequisites for this approach to work.
"The stock market is a device for transferring money from the impatient to the patient." — Warren Buffett. This observation becomes most actionable precisely when the Fear & Greed Index drops below 20 and patience is in shortest supply.
The Statistical Edge: Averages vs. Individual Events
Across the six episodes analyzed, the data shows a clear asymmetry. While a single event might disappoint in the short term (as the 2015 China episode showed with a modest +5.6% six-month return), the distribution of outcomes skews heavily positive. The worst 12-month return in our data set is +13.8%. The average is +36.7%. And the returns are largely uncorrelated to what caused the fear — whether it was credit crisis, pandemic, or policy error.
This is the statistical edge that contrarian sentiment investing attempts to capture: not perfect prediction of the bottom, but participation in a historically favorable risk/reward setup. You don't need to be right about the timing. You need to be willing to be early.
Combining Sub-20 Readings With Other Indicators
Experienced market participants rarely rely on the Fear & Greed Index alone. The most reliable setups combine a sub-20 reading with confirming signals from other sentiment and technical indicators:
- VIX above 40: When VIX and Fear & Greed simultaneously reach extreme levels, the historical hit rate for forward positive returns is even higher. See our analysis on VIX above 30 as a contrarian signal.
- AAII Bearish Sentiment above 55%: When more than half of individual investors surveyed are bearish, it's historically a bullish contrarian signal that often coincides with sub-20 Fear & Greed readings.
- Credit spreads peaking: When high-yield spreads begin to narrow after reaching extreme widths, it often signals that the worst of the credit-driven selling is over.
- Breadth thrusts: A sudden, powerful surge in the percentage of stocks advancing (above 90% of NYSE advancing volume on multiple days) often marks the beginning of recoveries from extreme fear levels.
Practical Takeaways for Individual Investors
The research is clear: sub-20 Fear & Greed readings have historically represented exceptional long-term buying opportunities. But translating that knowledge into action requires more than intellectual agreement — it requires a concrete plan established before the panic hits.
- Pre-define your "fear buying" rules. Decide now what percentage of your cash you'll deploy at Fear & Greed levels of 20, 15, and 10. Write it down. Share it with an accountability partner if needed.
- Maintain a cash reserve specifically for these moments. If you're always fully invested, you can't act when the opportunity arrives. Even a 10–15% cash position earns you the ability to participate in these windows.
- Monitor the ThinqStock dashboard daily during periods of market stress. When markets start declining 2–3% per day for multiple sessions, begin watching the Fear & Greed reading closely.
- Use index funds or broad ETFs rather than individual stocks. During extreme fear, even good companies can continue falling. Diversification reduces the risk of a single corporate failure undermining your strategy.
- Set a minimum holding period. Commit to holding for at least 12 months any position initiated during a sub-20 Fear & Greed environment. The data shows 12-month returns are significantly stronger than 3-month returns in most episodes.
The hardest part of this strategy isn't the analysis — it's the execution under real-world conditions. When the news is at its most catastrophic, when your other positions are underwater, and when market commentators are debating whether the financial system itself is salvageable, buying more equities feels deeply counterintuitive. The historical data exists precisely to anchor you during those moments.
The Fear & Greed Index dropping below 20 doesn't guarantee a perfect entry point. But across six major market crises over 16 years, it has consistently marked the beginning of some of the best forward return windows in modern market history. That's not a coincidence — it's a function of human psychology, forced selling mechanics, and the long-run tendency of diversified equity markets to recover and grow.
Bookmark the ThinqStock dashboard and check it regularly. The next sub-20 reading will come — and when it does, you'll want to be prepared to act rather than paralyzed by the same fear that's driving the index to that level.