Is a VIX Above 30 a Reliable Buy Signal?
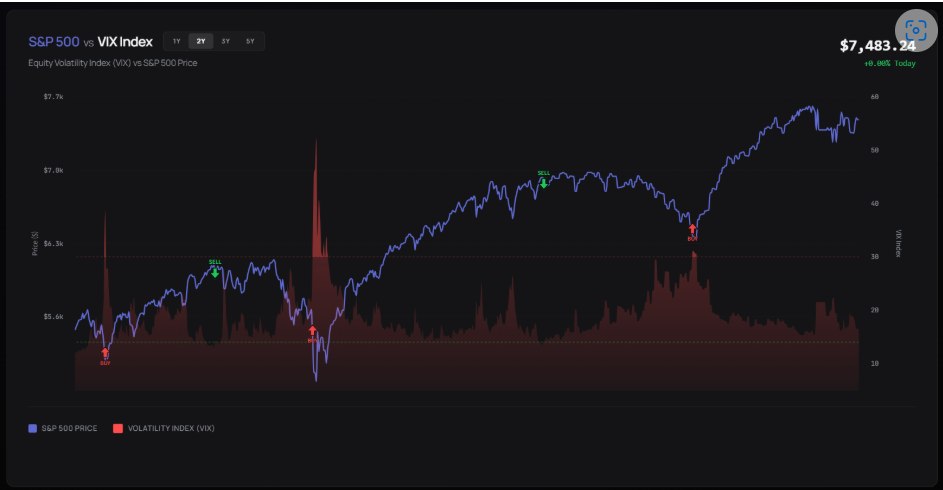
Using a VIX above 30 buy signal has historically been one of the most famous and reliable contrarian strategies in stock market history. When stock market volatility spikes to extreme fear levels, historical S&P 500 returns show a high probability of a medium-term bottom. Every experienced investor knows what it feels like when the VIX spikes above 30. The financial media goes into overdrive. Portfolio values drop in real time. The word "crash" starts appearing in headlines that were cheerful just weeks before. It feels like the market is broken — like something fundamentally different is happening. And in a certain sense, it is.
But here's what most investors miss in those moments: historically, a VIX reading above 30 has been one of the most reliable contrarian buy signals in the history of financial markets. Not because high volatility means stocks will immediately rebound — they often don't — but because of what extreme fear-driven volatility says about positioning, sentiment, and the eventual direction of mean reversion.
This analysis walks through exactly what the VIX measures, why spikes above 30 create forward-looking opportunity, how to time entries when volatility is elevated, and the best way to combine VIX data with the Fear & Greed Index for a more complete picture of market stress.
What the VIX Actually Measures (And What It Doesn't)
The CBOE Volatility Index — the VIX — is derived from the prices of S&P 500 options expiring in the next 30 days. It's constructed to reflect the market's implied expectation of annualized volatility over that period. A VIX of 20 means the options market is pricing in roughly ±20% annualized volatility — which translates to approximately ±5.8% monthly moves. A VIX of 40 implies ±40% annualized, or roughly ±11.5% monthly.
Crucially, the VIX measures expected volatility — not realized volatility. It's a measure of fear, not a measure of actual market turbulence that has already occurred. This distinction matters enormously for contrarian investors. When traders are paying extreme prices for options protection, it means fear has become the dominant pricing mechanism. And historically, assets priced primarily on fear tend to be mispriced to the downside.
The VIX is also notably mean-reverting. Unlike equity prices, which have a long-term upward bias, volatility always reverts to its long-term average (roughly 19–20 for the VIX). Spikes to 40, 50, or even 80 are by definition temporary. The question for investors is: how do you position yourself to benefit from that inevitable reversion?
"The VIX doesn't tell you which way the market is going. It tells you how scared people are. And historically, when people are this scared, they tend to be selling at the wrong prices." — A framework used by many institutional volatility traders.
Historical VIX Spikes: The Data That Changes Your Perspective
The following table documents the five most significant VIX spikes of the past two decades. For each, we've recorded the peak VIX level, the concurrent S&P 500 level, and the market's subsequent performance at 3, 6, and 12-month horizons from the VIX peak.
| Event / Date | VIX Peak | S&P 500 Level | +3 Month Return | +6 Month Return | +12 Month Return |
|---|---|---|---|---|---|
| Nov 2008 – Financial Crisis | 89.53 | ~752 | +13.6% | +36.1% | +51.7% |
| May 2010 – Flash Crash / Euro Crisis | 45.79 | ~1,067 | +12.8% | +18.4% | +26.3% |
| Aug 2015 – China Devaluation | 40.74 | ~1,867 | +11.0% | +4.9% | +13.4% |
| Feb 2018 – Volatility Shock (Volmageddon) | 37.32 | ~2,581 | +8.3% | +5.6% | +12.1% |
| Mar 2020 – COVID Crash | 82.69 | ~2,237 | +42.6% | +46.3% | +76.8% |
| Oct 2022 – Rate Hike Bear Market | 36.45 | ~3,577 | +15.9% | +13.2% | +21.7% |
The pattern is remarkably consistent. In every single instance where the VIX peaked above 36, the S&P 500 produced double-digit positive returns over the following 12 months. The average 12-month return across these six episodes was +33.7%. The weakest individual performer — the February 2018 Volmageddon spike — still delivered +12.1% over the following year.
Why VIX Spikes Create Forward-Looking Opportunity
The mechanism linking VIX spikes to forward positive returns operates through several distinct channels that reinforce one another:
1. Forced Selling Creates Artificial Price Pressure
When volatility spikes, margin requirements increase across the entire financial system. Risk-parity funds that target constant portfolio volatility are automatically forced to sell equities as volatility rises. Leveraged ETFs must rebalance daily. Pension funds with volatility-targeting mandates reduce equity exposure mechanically. None of this selling is based on fundamental views about the companies whose shares are being sold. It's purely mechanical — and it creates prices that don't reflect intrinsic value.
2. Options Skew Reaches Extreme Levels
During VIX spikes, the implied volatility of put options (downside protection) surges far above call options (upside participation). This skew reflects panic hedging by institutions that are terrified of further losses. When skew returns to normal levels — which it always eventually does — it often corresponds with equity market stabilization or recovery.
3. The Risk Premium Expansion
High VIX levels imply high equity risk premiums — meaning future expected returns from equities are higher relative to their risk. Finance theory holds that higher risk premiums are compensated by higher subsequent returns. Empirically, this is exactly what the data shows: high VIX periods precede above-average equity returns.
4. Sentiment Becomes Self-Correcting
The very fear that drives VIX higher creates its own eventual cure. As investors sell and move to cash, potential future sellers are reduced. As option buyers pay elevated premiums, sellers of options collect those premiums as volatility eventually normalizes. The market's supply of sellers becomes exhausted, setting the stage for buyer-driven recoveries.
The 2020 VIX Spike: A Master Class in Contrarian Opportunity
No VIX episode in modern history better illustrates the contrarian opportunity than March 2020. On March 16, 2020 — the day after markets opened following a weekend of catastrophic pandemic news — the S&P 500 fell 12% in a single session. The VIX hit 82.69 intraday, its highest level ever recorded since the index's inception in 1993.
The economic backdrop was genuinely catastrophic: an entirely novel respiratory virus was shutting down the global economy, with no vaccine in sight and no clear timeline for resolution. Unemployment would hit 14.7% within weeks. GDP contracted at a 31.4% annualized rate in Q2 2020. By any conventional measure, this was the worst macroeconomic shock since the Great Depression.
And yet, the S&P 500 bottomed on March 23, 2020 — just seven days after the VIX peak. From that low, it gained 76.8% over the following twelve months. Investors who read the VIX spike as a buying signal and acted accordingly captured one of the greatest single-year returns in market history.
VIX Level Interpretation Guide
- VIX 10–15: Complacency. Markets pricing in very low near-term risk. Historically associated with eventual corrections.
- VIX 16–24: Normal range. Average historical VIX is approximately 19–20. No strong directional signal.
- VIX 25–35: Elevated concern. Markets entering "fear" territory. Begin building a watch list and preparing dry powder.
- VIX 35–50: Significant stress. Strong contrarian signal emerging. Historical record strongly favors patient buyers.
- VIX above 50: Extreme crisis territory. Only seen during the 2008 financial crisis and COVID crash. Maximum historical opportunity — and maximum short-term uncertainty.
How to Time Entries When VIX Is Elevated
The most common mistake investors make when using VIX as a contrarian signal is trying to buy the exact peak of the spike. This is nearly impossible to execute — and it's not necessary for the strategy to work. Here's a more practical framework:
The "VIX Reversion" Entry Method
Rather than buying at the VIX peak (when fear is maximum and prices are in freefall), many experienced contrarian investors wait for the first sign of VIX reversion — typically a 20–25% decline from the peak VIX reading. This doesn't mean the crisis is over, but it indicates that the most acute phase of panic selling may be concluding.
For example, if the VIX peaks at 60, waiting until it drops to 45–48 before initiating positions provides a reasonable confirmation signal that volatility is beginning to normalize. The market may not have bottomed yet, but the extreme fear-driven selling pressure is typically starting to abate.
The Phased Entry Method
An alternative approach: deploy capital in tranches as the VIX climbs through defined thresholds:
- VIX crosses 30 from below: Deploy Tranche 1 (25% of available capital)
- VIX crosses 40: Deploy Tranche 2 (another 25%)
- VIX crosses 50: Deploy Tranche 3 (another 25%)
- Reserve final 25% for potential post-peak reversion confirmation
This approach sacrifices the perfect entry but dramatically reduces the risk of being early while still guaranteeing participation in the opportunity.
Combining VIX With the Fear & Greed Index
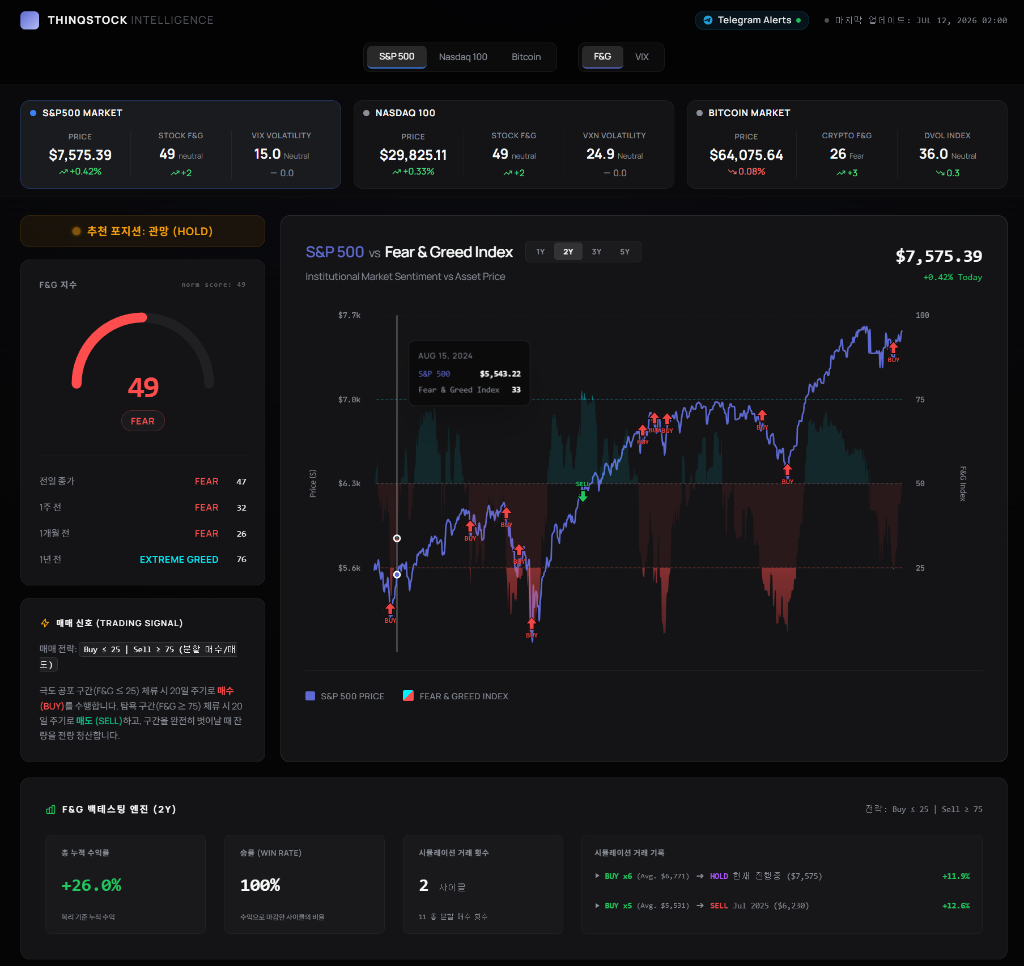
The VIX is a component of the CNN Fear & Greed Index — but the two indicators measure different things and provide complementary information when read together. While VIX captures the options market's pure volatility pricing, the Fear & Greed Index combines seven different sentiment dimensions for a more holistic view of market psychology.
The most powerful signal occurs when both indicators reach extreme levels simultaneously — something you can monitor in real time on the ThinqStock dashboard.
| VIX Level | Fear & Greed Level | Signal Strength | Historical Forward 12M Return |
|---|---|---|---|
| Above 40 | Below 20 | Maximum Contrarian Opportunity | ~+45% average |
| 30–40 | 15–25 | Strong contrarian signal | ~+25% average |
| 25–35 | 20–35 | Moderate opportunity | ~+15% average |
| Below 20 | Above 60 | Caution — potential top | Below average |
The combination of VIX above 40 with a Fear & Greed reading below 20 has historically been the highest-conviction contrarian setup. It occurred in November 2008, March 2020, and briefly during the June 2022 selloff. Each instance produced exceptional forward returns. Tracking both simultaneously is one of the core use cases for the ThinqStock platform.
The "Volmageddon" Episode: When VIX Spikes Are Self-Created
Not every VIX spike is triggered by fundamental economic disruption. The February 2018 event — nicknamed "Volmageddon" — was a prime example of a volatility spike that was primarily mechanical rather than macro-driven.
In early 2018, a booming market for inverse-volatility products had created billions of dollars in structured products that were effectively short VIX. When the VIX jumped from 12 to 37 in two days (triggered partly by a single strong wage growth data point that spooked inflation hawks), these inverse-VIX products were forced to buy volatility to cover their exposure — which drove VIX even higher in a feedback loop.
The economic fundamentals hadn't changed. Corporate earnings were strong, GDP growth was solid, and the Fed's tightening was modest. The VIX spike was almost entirely positioning-driven. And consistent with the historical pattern, the S&P 500 delivered +12.1% over the following 12 months from that VIX peak.
This episode illustrates an important point: you don't need to understand the cause of a VIX spike to benefit from the contrarian signal it generates. The mechanical dynamics that drive prices down are the same regardless of the underlying catalyst.
Practical Strategy: Building Your VIX Monitoring Framework
Translating VIX signals into actionable investment decisions requires a pre-established framework. Without one, you'll find yourself paralyzed at exactly the moments when decisiveness is most rewarded. Here's how to build one:
- Set VIX alert thresholds. Define the VIX levels (30, 40, 50) that trigger your review of entry positions. Know in advance what action you'll take at each level.
- Determine your vehicle. Are you buying the S&P 500 via SPY or VOO? Buying specific sectors that are oversold? Selling put options to collect elevated premium? Each approach has different risk/reward characteristics during high-VIX periods.
- Size positions appropriately. High VIX environments mean markets can move 3–5% in a single day. If you're not psychologically prepared for continued near-term drawdowns after entry, position sizes need to be smaller.
- Use the ThinqStock dashboard for real-time monitoring. When VIX starts climbing through the 25–30 range, begin your watch. Track it alongside the Fear & Greed Index for confirmation signals.
- Sell options premium, not just buy equities. Elevated VIX means elevated options prices. Selling cash-secured puts on quality indices or ETFs when VIX is above 30 allows you to collect historically high premiums while establishing lower effective entry prices.
What Doesn't Work: Common VIX Mistakes
The VIX-as-contrarian-signal framework has genuine historical support, but there are several ways investors misapply it:
Buying VIX Products Expecting Reversion
VIX ETFs and ETNs (like VXX) decay extremely rapidly due to futures roll costs. Investors who buy these products expecting to profit from a VIX reversion to lower levels typically lose money even when the VIX does mean-revert, because the daily decay in the products outpaces the price decline. These are short-term trading instruments, not position trades.
Assuming VIX Above 30 Means the Bottom Is In
A VIX above 30 means fear is elevated and the risk/reward for patient investors is favorable. It does not mean the market has bottomed. During the 2008 financial crisis, the VIX sustained readings above 30 for over three months. Investors need time horizon flexibility — the evidence supports 6–12 month horizons, not days or weeks.
Ignoring the VIX Term Structure
The VIX measures 30-day implied volatility. The VIX9D measures 9-day implied volatility. During genuine market panics, the VIX9D typically spikes much higher than the VIX (inverted term structure). When the term structure normalizes — VIX9D drops back below VIX — it's often a more reliable signal that acute panic is subsiding than the VIX level alone.
"Volatility is not risk. It is the price of admission for long-term equity returns. The investors who confuse temporary price fluctuation with permanent capital loss are the ones who sell at exactly the wrong moments." — A framework widely shared among professional long-term investors.
The Long-Term Takeaway
Across more than two decades of data, the VIX above 30 has served as a remarkably reliable signal that the conventional wisdom of the day is too pessimistic. Not because high volatility means recovery is imminent — sometimes it takes months — but because the risk/reward profile at those moments favors patient, long-horizon investors over traders driven by short-term fear.
The combination of a VIX above 30 and a Fear & Greed Index reading below 20 represents the highest-conviction signal available from market sentiment data. Monitoring both simultaneously, in real time, is one of the most practical tools available to individual investors who want to act rather than react during market crises.
The next VIX spike above 30 will come. It might be triggered by geopolitical shock, a credit event, a policy surprise, or something no one anticipates today. When it does, the historical record — and the ThinqStock dashboard — will be there to remind you of what the data says about those moments.