Stock vs Crypto Sentiment Divergence: How to Profit From the Gap
Two sentiment gauges. Two markets. And sometimes, a gap between them so wide it screams opportunity to anyone paying attention. The divergence between stock market Fear & Greed readings and crypto Fear & Greed readings is one of the most underappreciated signals available to cross-market traders today — not because it's obscure, but because most investors only track one market at a time and never see the gap forming until it's already closed.
Understanding why stocks and crypto develop sentiment divergences — and how to systematically exploit those divergences — requires a grasp of the structural differences between these two markets, the role of macro drivers in creating convergence, and the behavioral dynamics that make extreme gaps unsustainable over time. This guide breaks down the mechanics and provides four actionable trading frameworks for capturing divergence-to-convergence moves.
Why the Two Indices Diverge
Stock market sentiment and crypto sentiment share many of the same underlying inputs — investor psychology, risk appetite, macro economic expectations — but the weights and sensitivities are dramatically different. Crypto markets operate 24 hours a day, seven days a week, with no circuit breakers, no market makers with regulatory obligations to provide liquidity, and a participant base that skews younger, more speculative, and more emotionally reactive than the institutional investor base that dominates equity markets.
Different Leverage Profiles
One of the biggest drivers of sentiment divergence is leverage. Crypto derivatives markets routinely see open interest representing 30-50% of the total market capitalization of the underlying asset — a leverage ratio that would be considered extreme in equity markets. When sentiment shifts in crypto, it shifts violently because leveraged positions amplify both the price move and the psychological response to that price move. A 10% down day in crypto feels catastrophically different from a 10% down day in equities, even though the math is identical, because the leverage ratios mean the average participant has lost a far higher percentage of their equity. This creates extreme fear readings in crypto that have no parallel in the stock market for the same macroeconomic backdrop.
Different Investor Timelines and Goals
Equity markets are dominated by long-horizon institutional investors — pension funds, endowments, mutual funds — with defined liabilities and regulatory constraints that force disciplined rebalancing. Crypto markets have no equivalent. The marginal participant in crypto is often a retail trader with a six-to-twelve month investment horizon at most, using mobile apps with one-click access to 20x leverage. This means crypto sentiment is a purer, more volatile, and more extreme reflection of short-term risk appetite than anything observable in equity markets.
Liquidity and Market Depth Differences
U.S. equity markets trade several trillion dollars of notional value per day. Even large-cap cryptocurrencies like Bitcoin and Ethereum trade a fraction of that volume, meaning that smaller flows can create much larger price impacts in crypto — and therefore much larger and faster sentiment swings. A $1 billion institutional allocation into Bitcoin moves that market far more than a $1 billion allocation into Apple moves the equity market, generating outsized fear or greed readings relative to the actual significance of the capital flow.
"When crypto goes to extreme greed while stocks are merely in greed territory, the crypto market is pricing in a parabolic continuation that history tells us almost never materializes. The gap almost always closes at crypto's expense — not stock markets' gain."
Historical Divergence Case Studies
Two periods stand out as textbook examples of how sentiment divergence between stocks and crypto creates identifiable, exploitable trading opportunities — one showing crypto extended beyond stocks to the upside, the other showing crypto more fearful than stocks to the downside.
| Period | Stock F&G | Crypto F&G | Divergence Gap | Outcome |
|---|---|---|---|---|
| March 2021 | 70 — Greed | 90 — Extreme Greed | +20 points (Crypto more greedy) | Bitcoin corrected ~50% over following 3 months; S&P 500 continued higher |
| November 2022 | 35 — Fear | 5 — Extreme Fear | -30 points (Crypto more fearful) | BTC bottomed near $15,500; stocks hadn't yet found their low — stocks fell further while crypto recovered |
| January 2023 | 30 — Fear | 55 — Neutral/Greed | +25 points (Crypto recovering faster) | Crypto led stock recovery; equities followed 4-6 weeks later as macro sentiment improved |
| November 2021 | 72 — Greed | 84 — Extreme Greed | +12 points (Crypto more greedy) | Crypto peaked at $69k and entered a 12-month bear market; stocks peaked 2 months later |
Deep Dive: March 2021
In March 2021, Bitcoin had just crossed $60,000 for the first time. Crypto sentiment was registering at 90 — a level that historically has marked the final parabolic phase of a cycle. Stock market sentiment was elevated at 70 — bullish, but not frothy in the same way. The 20-point gap between them was telling a story: crypto had run significantly ahead of the macro backdrop and was pricing in continuation that even a bullish equity market wasn't pricing in.
What followed was a 53% correction in Bitcoin from its $64,000 peak in April 2021 to around $30,000 in June 2021. The S&P 500 during the same period didn't even experience a 5% pullback. The divergence had identified exactly where the overextension was — and the mean reversion happened at crypto's expense, not through a crash in equities. Investors who shorted or reduced crypto exposure when the divergence hit 20+ points captured one of the cleaner risk/reward setups of that year.
Deep Dive: November 2022
November 2022 brought the FTX collapse — one of the largest fraud scandals in financial history. The crypto Fear & Greed Index plunged to 5 — practically zero — while the stock market, already pricing in a grinding Fed tightening cycle, registered a still-uncomfortable but far less extreme 35. The 30-point gap between them told a different story this time: crypto had become more fearful than the macro environment warranted, even accounting for FTX-specific contagion risk.
Bitcoin bottomed at approximately $15,500 in mid-November 2022. The S&P 500 did not find its final bottom until January 2023. Crypto recovered first, and investors who recognized the extreme divergence in the bearish direction — crypto at extreme fear while stocks were merely in fear — were positioned to capture the first 60%+ of Bitcoin's recovery from $15,500 to $25,000 by early 2023, while equity-only investors were still waiting for macro clarity.
Crypto as a Leading Indicator for Stock Market Sentiment
One of the most counterintuitive findings from cross-market sentiment analysis is that crypto sometimes leads equity market sentiment rather than following it. Because crypto market participants react faster — no regulatory constraints, 24/7 trading, higher emotional sensitivity — the crypto sentiment gauge can sometimes price in macro sentiment shifts before equity markets fully reflect them.
This leading indicator relationship is not consistent. It tends to emerge most clearly when the driver of sentiment change is macro-driven (interest rate expectations, dollar strength, global liquidity conditions) rather than equity-specific (earnings surprises, M&A activity, sector rotations). When the driver is macro, crypto — with its higher sensitivity to global liquidity and risk appetite — picks up the signal first and with greater intensity.
The January 2023 example from the table above illustrates this. Bitcoin and Ethereum began recovering aggressively in January 2023 even as equity investors remained skeptical about Fed policy pivots. Crypto's sentiment recovery led the equity market recovery by approximately four to six weeks, giving cross-market analysts an early signal that risk appetite was returning faster than the equity market was pricing in.
Four Divergence Trading Strategies
Recognizing a divergence is the first step. Knowing how to position around it is the second — and more profitable — step. These four frameworks cover different investor profiles and risk tolerances.
Strategy 1: Crypto Overbought Relative to Stocks — Reduce Crypto Exposure
When the crypto F&G index exceeds the stock F&G index by 20 or more points, and both are in positive (above 50) territory, the historical record suggests crypto is priced for perfection while stocks are priced for merely good outcomes. The trade: trim crypto positions to target weight, take partial profits on leveraged crypto exposure, and wait for the gap to narrow before adding back exposure. This isn't a short signal — it's a risk management signal. The expected value of holding maximum crypto exposure when sentiment is 20+ points more extreme than equities is negative based on historical outcomes.
Strategy 2: Crypto Oversold Relative to Stocks — Increase Crypto Exposure Selectively
When crypto F&G is 20+ points below stock F&G — particularly when crypto is in extreme fear while stocks are in neutral or mild fear — the trade is to begin scaling into crypto exposure. Not all at once; the extreme fear environment means prices can still move lower before the recovery. A graduated accumulation approach — buying 25% of target position at the divergence extreme, adding 25% more after a 5-day stabilization, and completing the position over the next 30 days — captures the recovery while managing the risk of catching a falling knife during a genuine structural crisis.
Strategy 3: Pair Trade — Long Stocks, Short Crypto Futures
For sophisticated investors with access to crypto derivatives, a classic pair trade emerges when crypto sentiment massively exceeds stock sentiment in greed territory. Going long S&P 500 futures and short Bitcoin futures in a roughly dollar-neutral structure benefits from the convergence regardless of the macro direction — if the broader market falls, Bitcoin falls more; if the broader market rises, Bitcoin's premium to the macro backdrop compresses. This trade isolates the divergence alpha while reducing directional market exposure.
Strategy 4: Volatility Arbitrage Using the Divergence Signal
A more advanced approach uses the divergence as a signal to buy volatility (options) on the market that looks most extended relative to the other. When crypto is at extreme greed while stocks are neutral, buying put options on Bitcoin (or call options on crypto volatility products) captures the eventual mean reversion without requiring a directional short. The divergence signal tells you which market's volatility is likely underpriced relative to the underlying risk — and that's where the premium of long volatility strategies is most favorable.
Risk Management When Trading Divergences
Divergence trades have a seductive quality — they feel like free money because the logic is so clean. But the two most dangerous words in trading are "it's obvious," and sentiment divergences can persist longer than any rational model would predict. March 2021's crypto extreme greed reading actually expanded briefly before the correction began. Investors who sized maximum short positions at the first sign of divergence were squeezed before the trade ultimately worked.
Risk Management Rules for Divergence Trading
- Position sizing: Never risk more than 2% of portfolio on a single divergence trade; these are probability bets, not certainties
- Timing: Divergences are better entry signals than timing signals — they identify where to position, not exactly when the move will occur
- Stop losses: For crypto-short trades, a stop at 15% above entry prevents catastrophic loss during momentum extensions
- Confirmation: Wait for at least one of the following before entering: volume confirmation, on-chain data turning bearish, or derivative funding rates going extreme positive
- Macro override: If the Federal Reserve is actively adding liquidity or cutting rates, divergence signals toward crypto are less reliable — liquidity trumps sentiment in the short run
The key is treating divergence signals as one input in a broader decision framework rather than a standalone trading trigger. When divergence aligns with technical analysis, on-chain data, and macro conditions, the confidence in the trade increases substantially. When divergence contradicts the other signals, patience is the right response.
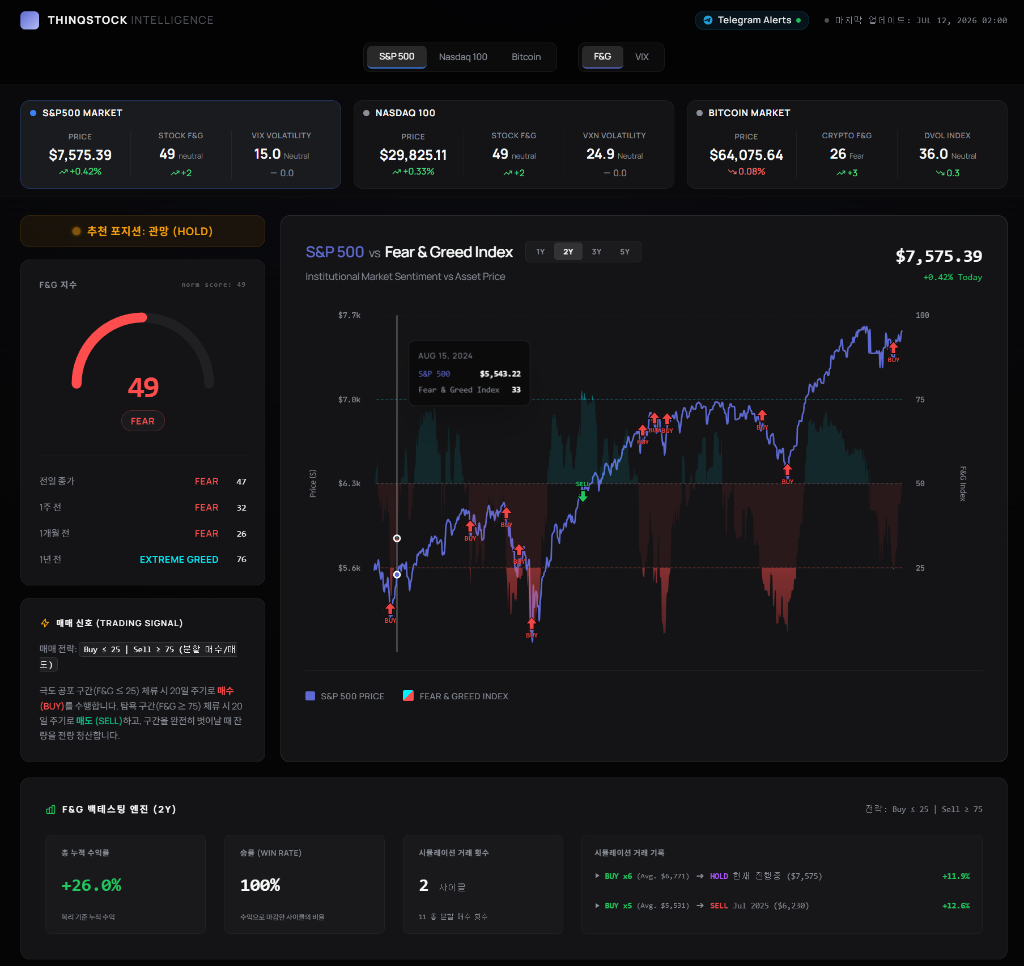
Cross-market sentiment analysis is one of the more powerful edge sources available to retail and professional investors alike. The ThinqStock platform tracks both stock and crypto sentiment daily, giving you the tools to identify these divergences as they form — before they close. The gap is where the money is. Knowing when it's real is the skill.