Win Rate in Trading: Why 50% Can Beat 80% and How to Evaluate Your Strategy
Imagine you're evaluating two trading strategies. Strategy A wins 80% of its trades. Strategy B wins only 50%. Most retail traders would immediately choose Strategy A without a second thought — because winning 80% of the time sounds obviously better. That instinct is wrong, and understanding exactly why it's wrong is one of the most important conceptual leaps any developing trader can make.
Win rate is not a performance metric. It's an input to a performance metric. Without knowing what happens on the winning trades versus the losing trades — the average gain versus the average loss — a win rate number tells you almost nothing about whether a strategy is actually profitable. The math of trading profitability is built around the relationship between win rate and risk-reward ratio, and until you internalize that relationship, you cannot evaluate a strategy with any accuracy.
What Win Rate Actually Means
Win rate is the percentage of closed trades that produce a profit. A strategy that executes 100 trades and profits on 62 of them has a win rate of 62%. That's the entire definition. Win rate says nothing about the size of those wins, nothing about the size of the losses, and nothing about the total profit or loss generated over the trade sample.
This is where most retail traders go wrong. They optimize their strategies for high win rate — using tight profit targets and wide stop losses so that trades frequently hit the target before the stop — and end up with strategies that generate frequent small wins and occasional catastrophic losses. The resulting equity curve looks smooth until it suddenly isn't, and the total P&L over time is often negative despite the impressive win rate percentage.
The uncomfortable truth is that some of the world's most successful trading strategies — including many trend-following commodity trading advisors (CTAs) — operate with win rates between 35% and 45%. They profit because when they're right, they make five to ten times what they risk on each trade. They accept frequent small losses as the cost of staying in the game for the occasional large winner that drives the bulk of their annual return.
The Relationship Between Win Rate and Risk-Reward Ratio
The correct way to think about trading performance is through expected value — the average dollar outcome per trade, calculated by combining win rate with the average dollar gain per winning trade and average dollar loss per losing trade.
The formula is simple:
Expected Value per Trade = (Win Rate × Average Win) − (Loss Rate × Average Loss)
Where Loss Rate = 1 − Win Rate. This formula makes it immediately clear that a high win rate combined with a poor average win-to-loss ratio can produce negative expected value, while a lower win rate with a superior win-to-loss ratio can produce strongly positive expected value. Let's make this concrete with real numbers.
The Math: Strategy A vs Strategy B
| Metric | Strategy A (High Win Rate) | Strategy B (Balanced) |
|---|---|---|
| Win Rate | 80% | 50% |
| Loss Rate | 20% | 50% |
| Average Win | $500 | $1,500 |
| Average Loss | $2,000 | $500 |
| Risk-Reward Ratio | 1:4 (risking $2,000 to make $500) | 3:1 (making $1,500 to risk $500) |
| Wins in 10 Trades | 8 wins × $500 = $4,000 | 5 wins × $1,500 = $7,500 |
| Losses in 10 Trades | 2 losses × $2,000 = $4,000 | 5 losses × $500 = $2,500 |
| Net P&L per 10 Trades | $0 (breakeven before costs) | +$5,000 |
| Expected Value per Trade | $0 | +$500 |
Strategy A, with its 80% win rate, is a breakeven strategy before transaction costs. Once you account for commissions, spreads, and slippage — which are real costs that compound over hundreds of trades — Strategy A is a money-losing proposition despite winning four out of every five trades. Strategy B, winning only half its trades, generates $5,000 in net profit over the same 10-trade sample and $500 of expected value per trade. At 100 trades per year, that's $50,000 in expected annual profit from the same capital base.
"A 50% win rate with a 3:1 reward-to-risk ratio is infinitely better than an 80% win rate that barely covers its losses. The market rewards those who let winners run and cut losers short — not those who take quick profits and hope the losses don't come."
The Breakeven Win Rate: A Crucial Concept
For any given risk-reward ratio, there is a breakeven win rate — the minimum win rate at which the strategy is profitable. Understanding this number for your own strategy is the foundation of honest strategy evaluation.
Breakeven Win Rate = Average Loss / (Average Win + Average Loss)
For a strategy with a 3:1 reward-to-risk ratio (average win of $1,500, average loss of $500), the breakeven win rate is $500 / ($1,500 + $500) = 25%. This means you only need to be right 25% of the time to avoid losing money — and anything above 25% generates profit. Compare this to Strategy A, where the breakeven win rate with its inverted 1:4 ratio is $2,000 / ($500 + $2,000) = 80%. You must be right 80% of the time just to break even. Any deviation below 80% loses money. These are completely different strategy profiles from a risk management perspective.
Historical Win Rates of Fear & Greed Strategies: ThinqStock Backtest Data
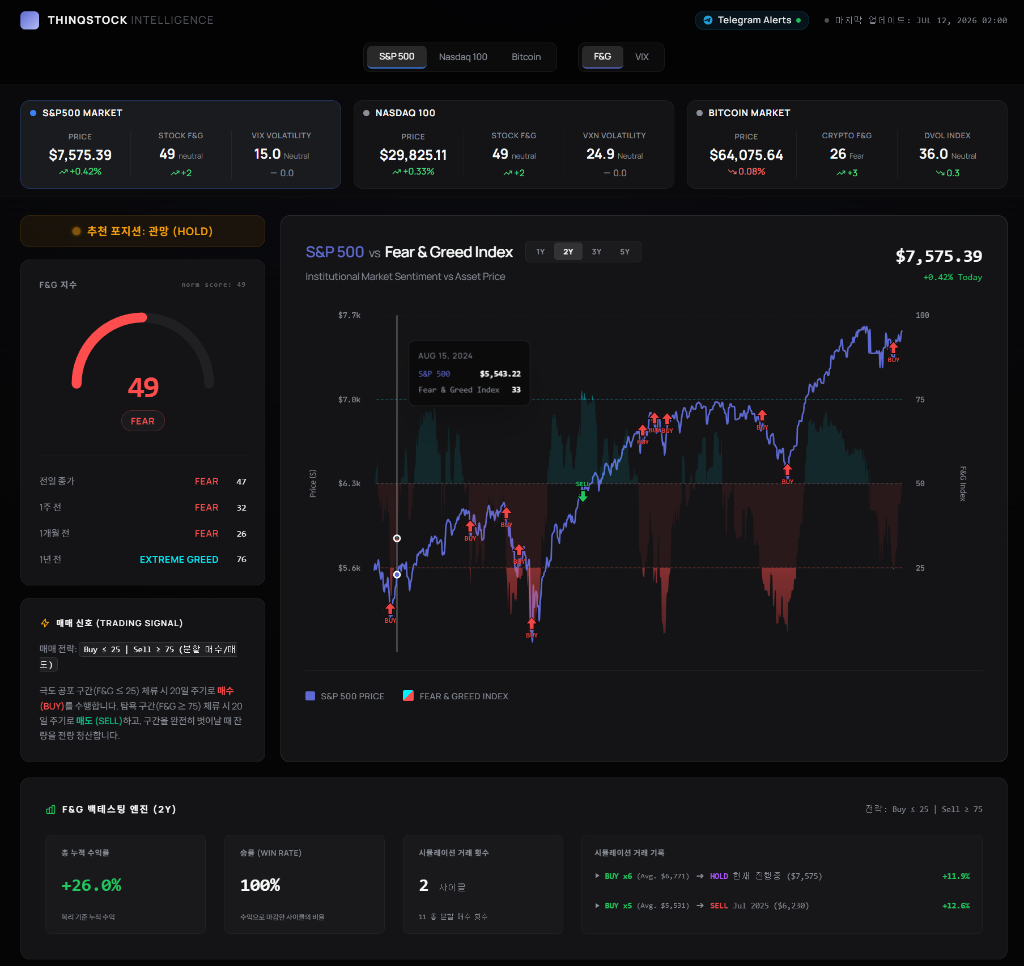
One of the most common questions users ask about ThinqStock's backtesting platform is: what win rate does a Fear & Greed-based strategy actually achieve? The answer depends heavily on which specific thresholds you use as entry and exit triggers, but the historical data provides a clear directional picture.
| Strategy Type | Entry Threshold (F&G) | Exit Threshold (F&G) | Avg Win Rate | Avg Holding Period | Notes |
|---|---|---|---|---|---|
| Extreme Fear Buy | Buy when <15 | Sell when >50 | 71% | 45–90 days | High win rate, fewer signals (rarer extremes) |
| Fear Buy | Buy when <25 | Sell when >55 | 68% | 30–70 days | Good balance of signal frequency and win rate |
| Moderate Contrarian | Buy when <35 | Sell when >65 | 62% | 20–50 days | More signals, slightly lower win rate but similar EV |
| Greed Short Signal | Short when >80 | Cover when <55 | 55% | 15–40 days | Lower win rate due to market upward bias; smaller position sizing recommended |
| Dual Threshold | Buy <20, Short >85 | Respective reversals | 67% | Varies | Combined approach; moderate signal frequency, solid win rate |
The 62-71% win rate range across F&G strategies is genuinely impressive. For context, most professional traders consider a strategy with a 55%+ win rate at reasonable risk-reward ratios to be a solid, sustainable edge. The F&G strategies are achieving materially above that benchmark — which is why sentiment-based investing has attracted serious attention from both retail and institutional market participants in recent years.
The key variable is the threshold aggressiveness. Using extreme thresholds (buy below 15, sell above 85) produces fewer but higher-quality signals with a 71% win rate — because you're only acting when sentiment has reached historically extreme and statistically anomalous levels. Using broader thresholds (buy below 35) produces more signals but with slightly lower win rates, because you're acting on sentiment that is more common and therefore less powerful as a contrarian indicator.
How to Interpret ThinqStock Backtest Results
When you run a backtest on ThinqStock's platform, you'll see a range of metrics alongside the win rate. Understanding what each metric tells you — and what its limitations are — is essential for making good strategy decisions.
Win Rate in Context
The win rate shown in backtest results is computed using the threshold rules you've set. A win is any trade that closes with a positive return; a loss closes with a negative return. The win rate figure doesn't tell you about the magnitude of those wins and losses — you need to look at the average win/loss dollar amounts or percentages to get the full picture. Always evaluate win rate alongside average win and average loss simultaneously.
Maximum Drawdown
Maximum drawdown is the peak-to-trough decline in the strategy's cumulative equity curve during the backtest period. A strategy that achieves a 68% win rate with a 15% maximum drawdown is far more practically useful than one with a 72% win rate and a 45% maximum drawdown — because most investors cannot psychologically or practically sustain a 45% drawdown without abandoning the strategy at the worst possible moment.
Sharpe Ratio
The Sharpe ratio — return divided by standard deviation of returns — provides a risk-adjusted performance measure that is superior to raw return or raw win rate for strategy comparison. A F&G strategy with a Sharpe ratio above 1.0 is generating more than one unit of return for each unit of risk taken, which represents a meaningful edge over passive investing.
Sample Size and Statistical Significance
Perhaps the most underappreciated aspect of backtest interpretation is sample size. A 71% win rate computed over 7 trades is statistically meaningless — you need a minimum of 30-50 trades to have any confidence that the result is not purely due to chance, and ideally 100+ trades for robust conclusions. The extreme fear threshold (F&G below 15) generates far fewer signals than moderate thresholds, which means the backtest sample is smaller and the statistical confidence is correspondingly lower. This doesn't make the strategy worse — extreme fear readings may still represent the best entry points — but it does mean you should size positions conservatively and not overfit your expectations to the backtest win rate.
Optimal Threshold Selection: The Strategy Optimization Process
The ThinqStock backtesting tool allows you to test different entry and exit threshold combinations to find the optimal parameters for your risk tolerance and investment horizon. The optimization process should follow a structured approach rather than simply picking whatever threshold produced the highest historical win rate.
A Framework for Threshold Selection
- Start with theory: What sentiment level do you believe represents a statistically meaningful extreme? For most investors, this is below 20 for fear entries and above 75 for greed exits.
- Backtest across a range: Test thresholds from 10 to 35 for entry and 45 to 75 for exit. Note the win rate, average holding period, and maximum drawdown at each combination.
- Check signal frequency: Count how many signals each threshold combination generates. Too few signals (fewer than 10 over 5 years) means the strategy is harder to execute and the backtest less statistically reliable.
- Apply the Sharpe ratio filter: Among threshold combinations with adequate signal frequency, choose the one with the highest Sharpe ratio rather than the highest raw return or highest win rate.
- Test on out-of-sample data: If your backtest was on 2010-2020 data, validate on 2020-2026 data before committing capital. Strategy decay between in-sample and out-of-sample performance is the single most common indicator of overfitting.
The Psychological Side of Win Rate
There's a deeply human dimension to the win rate discussion that pure mathematics ignores. Even when investors intellectually understand that a 50% win rate with 3:1 reward-to-risk is superior to 80% win rate with 1:4, they often find the lower win rate strategy psychologically harder to execute. Losing trades feel bad. Losing 50% of trades — even when the math is working in your favor — generates persistent doubt about whether the strategy is really working.
This psychological friction is why many profitable trading strategies are abandoned before they reach their full potential. The strategy generates several consecutive losses — which is statistically expected with a 50% win rate — and the trader, experiencing the pain of those losses, concludes the strategy is broken and stops following it. Often this abandonment happens just before a series of winners that would have recovered the losses and generated the expected profit.
The solution is pre-commitment. Before you begin trading any strategy, define in writing what the expected loss streaks look like based on the win rate, and commit to continuing the strategy through those streaks as long as the conditions for entry remain valid. With a 50% win rate strategy, a streak of five consecutive losses has a probability of approximately 3.1% — uncommon but not rare over 100 trades. A streak of eight consecutive losses has a probability of 0.4% — rare, but if you're running the strategy long enough, you'll eventually experience it. Knowing this in advance keeps you from interpreting normal statistical variance as strategy failure.
The ThinqStock guide walks through the complete backtesting methodology and explains how to read the platform's performance reports with the context needed to make sound strategy decisions. Win rate is the starting point — but the full picture requires understanding every number in the backtest output, and how they interact to determine whether a strategy is genuinely worth trading.